浏览二维绘图上的基本统计量
此示例说明如何使用数据统计工具以交互方式浏览绘图数据和对其进行摘要。使用此工具,您可以检查和可视化绘图上数据序列的基本统计量,并将统计量保存到 MATLAB 工作区以供进一步分析,而无需为每个统计量编写代码。
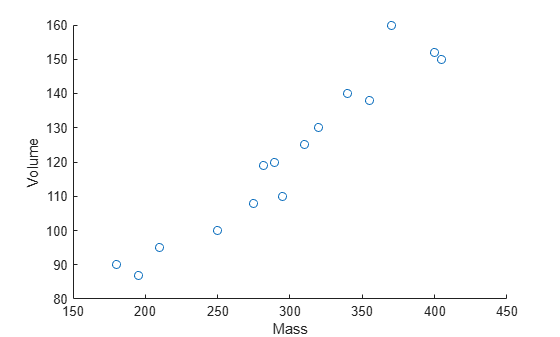
在此示例中,您分析由 15 块岩石的质量(克)和体积(立方厘米)测量值组成的样本数据。
Mass = [250 320 180 405 289 340 210 370 295 310 282 400 195 355 275]';
Volume = [100 130 90 150 120 140 95 160 110 125 119 152 87 138 108]';
T = table(Mass,Volume);
可视化数据
使用散点图可视化每块岩石的质量和体积数据。
scatter(T,"Mass","Volume")
在绘图上显示统计量
要使用数据统计工具,请在图窗的工具选项卡上,点击数据统计信息。数据统计工具显示质量和体积测量值的描述性统计量。要在绘图上显示特定统计量,请选中您要显示的每个统计量的复选框。
例如,要显示质量和体积的均值,请在 X 和 Y 列中选中均值复选框。此操作会在绘图上质量和体积的均值处创建一条垂直线和一条水平线,还会自动添加图例。
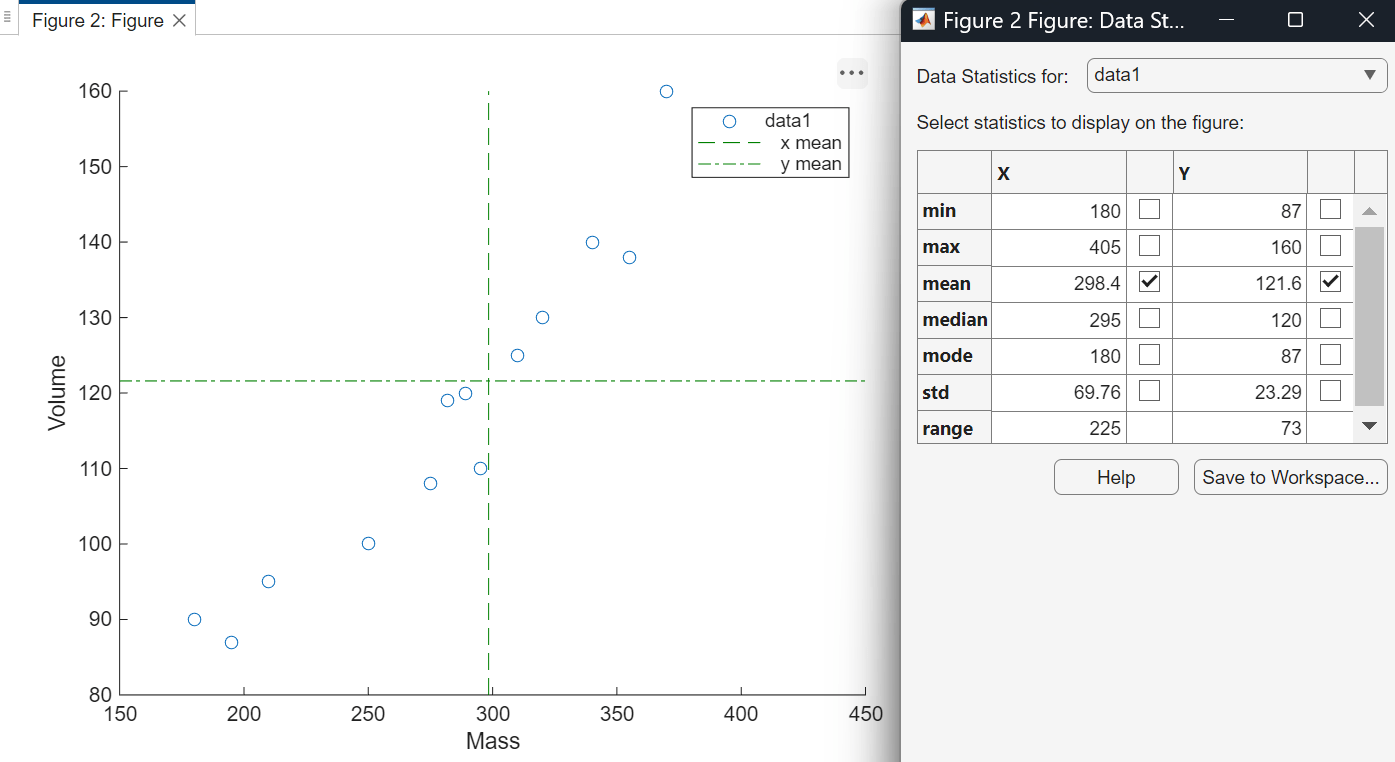
如果您的绘图包含多个数据序列,请在以下项的数据统计信息列表中,选择要为其计算统计量的序列。选择不同数据序列会从绘图中清除先前选择的数据序列的统计量。
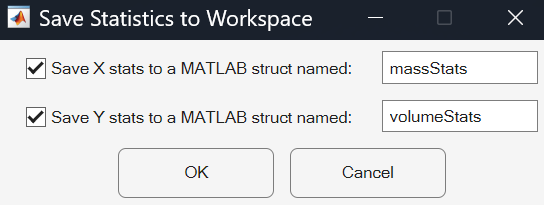
将统计量保存到工作区
要保存所有统计量以供进一步分析,请点击保存到工作区。数据统计工具将统计量以标量结构体形式保存在 MATLAB 工作区中。您可以为每个结构体指定名称。
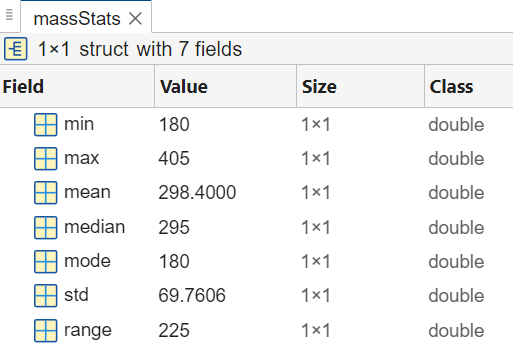
您可以在变量编辑器中查看每个结构体的内容。
openvar massStats
openvar volumeStats
您可以使用圆点表示法访问结构体中的统计量。例如,访问质量测量值的标准差,然后计算方差。
massVar = massStats.std .^ 2;