预测美国人口
此示例说明,即使使用次数最适中的多项式外插数据也是有风险且不可靠的。
此示例比 MATLAB® 出现得更早。该示例最初作为一个练习出现在福赛思、马尔科姆和莫勒尔合著的《Computer Methods for Mathematical Computations》一书中,该书由出版商 Prentice-Hall 在 1977 年出版。
现在,通过 MATLAB 可以更容易地改变参数和查看结果,但基础数学原理未变。
使用 1910 年至 2000 年的美国人口普查数据创建并绘制两个向量。
% Time interval
t = (1910:10:2000)';

% Population
p = [91.972 105.711 123.203 131.669 150.697...
    179.323 203.212 226.505 249.633 281.422]';

% Plot
plot(t,p,'bo');
axis([1910 2020 0 400]);
title('Population of the US 1910-2000');
ylabel('Millions');
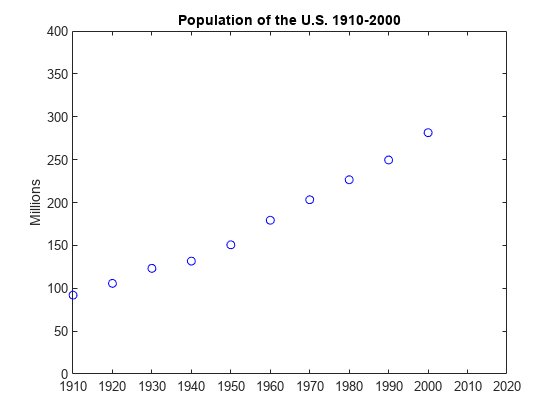
那么猜想一下 2010 年美国的人口是多少?
p
p = 10×1

   91.9720
  105.7110
  123.2030
  131.6690
  150.6970
  179.3230
  203.2120
  226.5050
  249.6330
  281.4220
将这些数据与 t 中的一个多项式拟合,并使用它将人口数外插到 t = 2010。通过对包含范德蒙矩阵的线性系统求解来获得多项式中的系数,该矩阵为 11×11,其元素为缩放时间的幂,即 A(i,j) = s(i)^(n-j)。
n = length(t);
s = (t-1950)/50;
A = zeros(n);
A(:,end) = 1;
for j = n-1:-1:1
   A(:,j) = s .* A(:,j+1);
end
通过对包含范德蒙矩阵最后 d+1 列的线性系统求解,获得与数据 p 拟合的 d 次多项式的系数 c:
A(:,n-d:n)*c ~= p
如果
d < 10,则方程个数多于未知数个数,并且最小二乘解是合适的。如果
d == 10,则可以精确求解方程,而多项式实际上会对数据进行插值。
在任一种情况下,都可以使用反斜杠运算符来求解方程组。三次拟合的系数为:
c = A(:,n-3:n)\p
c = 4×1

   -5.7042
   27.9064
  103.1528
  155.1017
现在,计算从 1910 年到 2010 年每一年的多项式,然后绘制结果。
v = (1910:2020)';
x = (v-1950)/50;
w = (2010-1950)/50;
y = polyval(c,x);
z = polyval(c,w);

hold on
plot(v,y,'k-');
plot(2010,z,'ks');
text(2010,z+15,num2str(z));
hold off
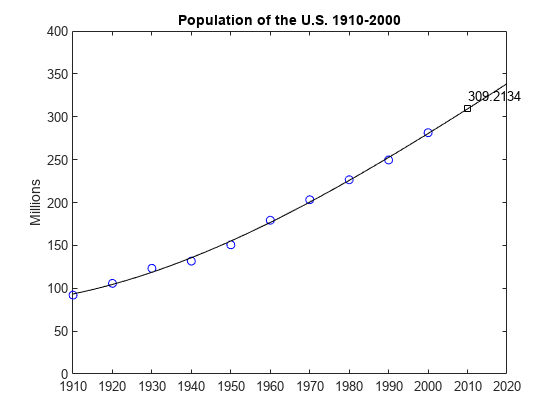
将三次拟合与四次拟合进行比较。请注意,外插点完全不同。
c = A(:,n-4:n)\p;
y = polyval(c,x);
z = polyval(c,w);

hold on
plot(v,y,'k-');
plot(2010,z,'ks');
text(2010,z-15,num2str(z));
hold off

随着阶数增加,外插变得越来越不可靠。
cla
plot(t,p,'bo')
hold on
axis([1910 2020 0 400])
colors = hsv(8);
labels = {'data'};
for d = 1:8
   [Q,R] = qr(A(:,n-d:n));
   R = R(1:d+1,:);
   Q = Q(:,1:d+1);
   c = R\(Q'*p);    % Same as c = A(:,n-d:n)\p;
   y = polyval(c,x);
   z = polyval(c,w);
   plot(v,y,'color',colors(d,:));
   plot(2010,z,'s','color',colors(d,:));
   labels{end+1} = ['degree = ' int2str(d)];
   labels{end+1} = '';
end
legend(labels, 'Location', 'NorthWest')
hold off
