主要内容

plot

R2026b

绘制 alpha 形状

描述

plot(shp) 在图窗窗口中绘制 alpha 形状 shp。

示例

plot(shp,Name=Value) 使用一个或多个名称-值参量指定的其他选项。有关允许的 Name=Value 对组的完整列表,请参阅 Patch 属性。

示例

h = plot(___) 结合上述语法返回 Patch 对象的句柄。

示例

全部折叠

创建一个三维点集。

[x1,y1,z1] = sphere(24);
x1 = x1(:);
y1 = y1(:);
z1 = z1(:);
x2 = x1 + 5;
P = [x1 y1 z1; x2 y1 z1];
P = unique(P,"rows");

使用 alpha 半径 1.5 创建并绘制一个 alpha 形状。

shp = alphaShape(P,1.5);
plot(shp)
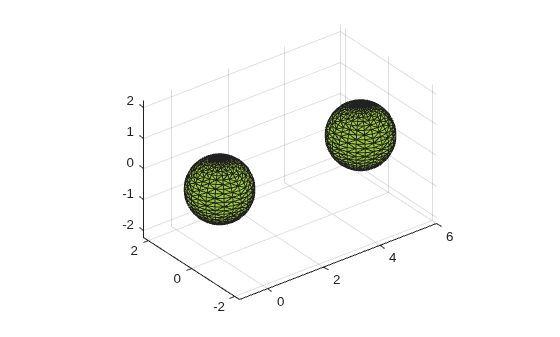
3-D alpha shape showing two triangulated spheres, one centered at the origin and one offset to the right

使用指定的颜色和透明度因子绘制 alpha 形状。

plot(shp,FaceColor="red",FaceAlpha=0.1)
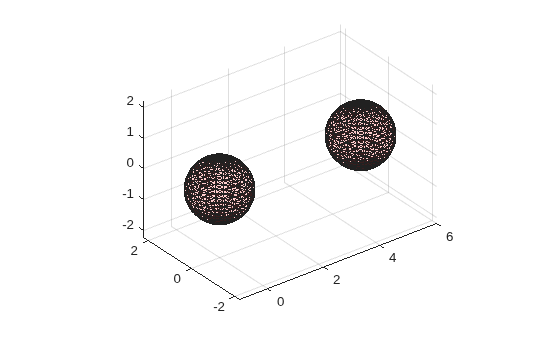
3-D alpha shape of two spheres plotted with red face color and high transparency, showing the triangulated mesh through the translucent surfaces

输入参数

全部折叠

alpha 形状,指定为 alphaShape 对象。有关详细信息,请参阅 alphaShape。

示例: shp = alphaShape(x,y) 根据 (x,y) 点坐标创建一个二维 alphaShape 对象。

输出参量

全部折叠

Patch 对象的句柄,以句柄形式返回。有关详细信息,请参阅补片对象简介。

版本历史记录

在 R2014b 中推出

另请参阅

|