compassplot

语法
说明
向量和矩阵数据
表数据
compassplot( 绘制表 tbl,thetavar,rhovar)tbl 中的变量 thetavar 和 rhovar。要绘制一组箭头,请为 thetavar 和 rhovar 各指定一个变量。要绘制多组箭头,请为 thetavar、rhovar 或两者指定多个变量。
其他选项
compassplot(___, 使用一个或多个名称-值参量指定 Name=Value)PolarCompassPlot 属性。在所有其他输入参量之后指定名称-值参量。有关属性列表,请参阅 PolarCompassPlot Properties。
cp = compassplot(___) 返回 PolarCompassPlot 对象。创建绘图后,使用 cp 获取和设置绘图的属性。有关属性列表,请参阅 PolarCompassPlot Properties。
示例
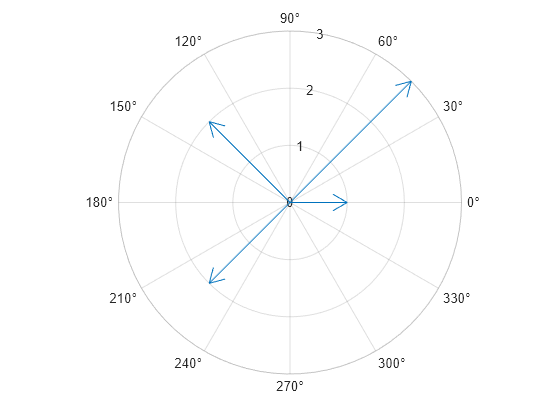
创建向量 theta 和 rho,并在罗盘图中绘制其值。
rho = [1 3 2 2];
theta = [0 pi/4 3*pi/4 5*pi/4];
compassplot(theta,rho)
通过获取极坐标区并将 ThetaAxisUnits 属性设置为 "radians",将 theta 轴刻度标签的显示更改为显示弧度值。
pax = gca;
pax.ThetaAxisUnits = "radians";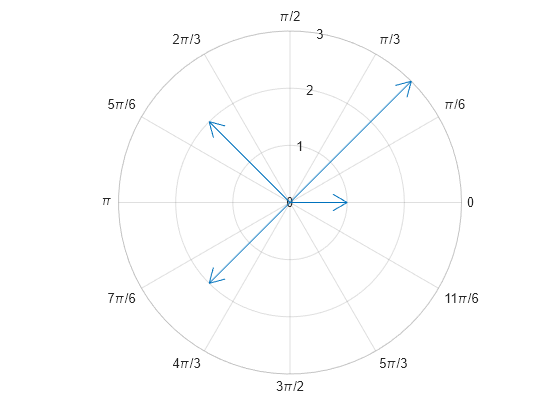
要绘制多组箭头,请将至少一组坐标指定为矩阵。您也可以在绘图命令之间调用 hold 函数。
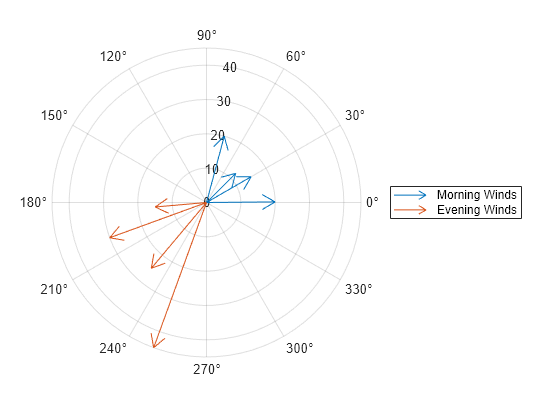
创建一个 4×2 风向值矩阵和一个 4×2 风速值矩阵。每个矩阵中的第一列对应于上午的数据,第二列对应于晚上的数据。将数据绘制为一个具有图例的罗盘图。
windDirection = deg2rad([0.5 185; 30 200; 45 230; 75 250]);
windSpeed = [20 15; 15 30; 12 25; 20 45];
compassplot(windDirection,windSpeed)
legend(["Morning Winds" "Evening Winds"])

您也可以一次绘制一组箭头,并在绘图命令之间调用 hold 函数。
% Create figure and data
figure
morningDirection = deg2rad([0.5 30 45 75]);
eveningDirection = deg2rad([185 200 230 250]);
morningSpeed = [20 15 12 20];
eveningSpeed = [15 30 25 45];

% Plot morning and evening data separately
compassplot(morningDirection,morningSpeed)
hold on
compassplot(eveningDirection,eveningSpeed)
hold off
legend(["Morning Winds" "Evening Winds"])
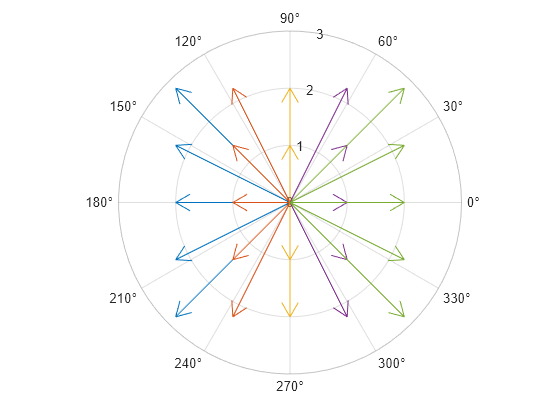
要绘制复数值,请指定一个由复数组成的向量或矩阵。例如,创建包含介于 -2 和 2 之间的数值的矩阵 a 和 b。创建一个由 a+bi 形式的复数组成的矩阵 Z 并对其绘图。compassplot 使用不同颜色分别绘制 Z 的每列。
[a,b] = meshgrid(-2:2);
Z = a + b*1i;
compassplot(Z)
您可以通过设置属性来修改绘图的各个方面。您可以在调用 compassplot 时通过指定名称-值参量来设置属性,也可以稍后使用圆点表示法设置属性。
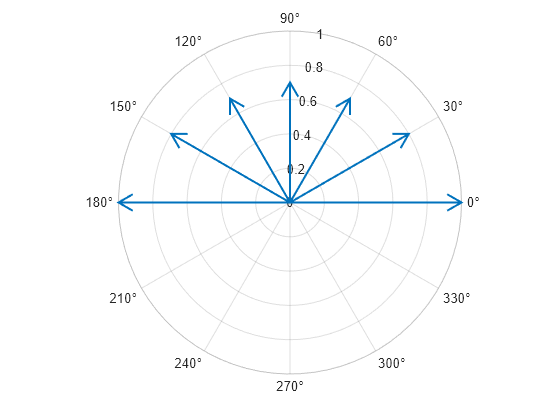
例如,绘制七个值,并通过设置 LineWidth 名称-值参量来指定线条粗细。此外,还要指定输出参量以存储 PolarCompassPlot 对象。
theta = 0:pi/6:pi;
rho = [1 0.8 0.7 0.7 0.7 0.8 1];
cp = compassplot(theta,rho,LineWidth=1.5);
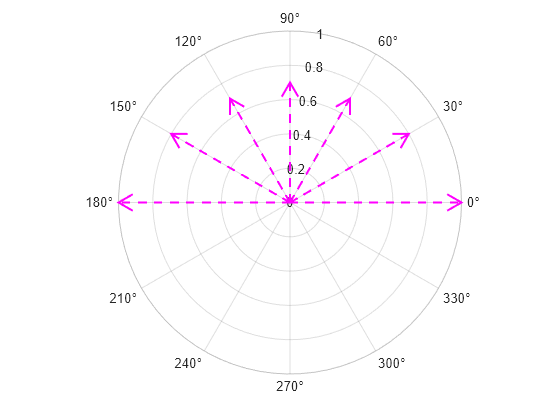
通过设置 PolarCompassPlot 对象 cp 的属性来进一步修改外观。将线条颜色更改为品红色,并将线型更改为虚线。
cp.Color = "magenta";
cp.LineStyle = "--";
创建一个包含两个变量 theta 和 rho 的表。
theta = [0 pi/4 pi/2]';
rho = [1 3 2]';
t = table(theta,rho);
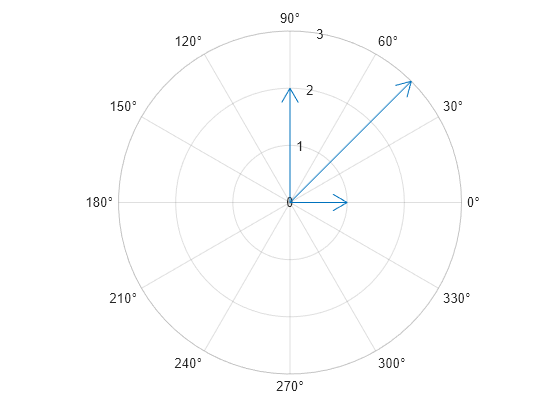
基于表创建一个罗盘图。
compassplot(t,"theta","rho")
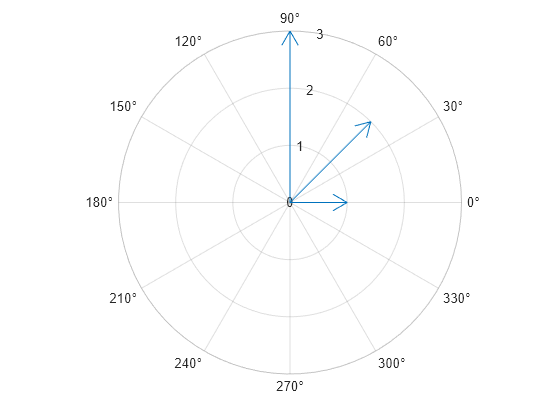
要绘制到特定的极坐标区对象中,请在调用 compassplot 时将极坐标区指定为第一个参量。例如,创建一个极坐标区对象并绘制到其中。此策略在以下情况下很有用:
您不希望
compassplot创建一个新极坐标区对象。您要保留现有坐标区对象的内容。
您正在 App 中创建绘图。
pax = polaraxes;
theta = [0 pi/4 pi/2];
rho = [1 2 3];
compassplot(pax,theta,rho)
输入参数
名称-值参数
将可选参量对组指定为 Name1=Value1,...,NameN=ValueN,其中 Name 是参量名称,Value 是对应的值。名称-值参量必须出现在其他参量之后,但对各个参量对组的顺序没有要求。
示例: compassplot([0 pi/4 pi/2],[1 2 3],LineWidth=1.5) 使用 1.5 磅的线宽创建一个罗盘图。
注意
此处所列的属性只是一部分。有关完整列表,请参阅 PolarCompassPlot Properties。
箭头颜色,指定为 RGB 三元组、十六进制颜色代码、颜色名称或短名称。
对于自定义颜色,请指定 RGB 三元组或十六进制颜色代码。
RGB 三元组是包含三个元素的行向量,其元素分别指定颜色中红、绿、蓝分量的强度。强度值必须位于
[0,1]范围内,例如[0.4 0.6 0.7]。十六进制颜色代码是字符串标量或字符向量,以井号 (
#) 开头,后跟三个或六个十六进制数字,范围可以是0到F。这些值不区分大小写。因此,颜色代码"#FF8800"与"#ff8800"、"#F80"与"#f80"是等效的。
此外,还可以按名称指定一些常见的颜色。下表列出了一些命名颜色选项、其等效 RGB 三元组及十六进制颜色代码。
| 颜色名称 | 短名称 | RGB 三元组 | 十六进制颜色代码 | 外观 |
|---|---|---|---|---|
"red" | "r" | [1 0 0] | "#FF0000" |
|
"green" | "g" | [0 1 0] | "#00FF00" |
|
"blue" | "b" | [0 0 1] | "#0000FF" |
|
"cyan" | "c" | [0 1 1] | "#00FFFF" |
|
"magenta" | "m" | [1 0 1] | "#FF00FF" |
|
"yellow" | "y" | [1 1 0] | "#FFFF00" |
|
"black" | "k" | [0 0 0] | "#000000" |
|
"white" | "w" | [1 1 1] | "#FFFFFF" |
|
"none" | 不适用 | 不适用 | 不适用 | 无颜色 |


下表列出了浅色和深色主题中绘图的默认调色板。
| 调色板 | 调色板颜色 |
|---|---|
在 R2025a 之前的版本中: 大多数绘图默认使用这些颜色。 |
|
|
|


您可以使用 orderedcolors 和 rgb2hex 函数获取这些调色板的 RGB 三元组和十六进制颜色代码。例如,获取 "gem" 调色板的 RGB 三元组并将其转换为十六进制颜色代码。
RGB = orderedcolors("gem");
H = rgb2hex(RGB);
在 R2023b 之前的版本中: 使用 RGB = get(groot,"FactoryAxesColorOrder") 获取 RGB 三元组。
在 R2024a 之前的版本中: 使用 H = compose("#%02X%02X%02X",round(RGB*255)) 获取十六进制颜色代码。
箭杆的样式,指定为下表中列出的线型之一。
| 线型 | 描述 | 表示的线条 |
|---|---|---|
"-" | 实线 |
|
"--" | 虚线 |
|
":" | 点线 |
|
"-." | 点划线 |
|
"none" | 无线条 | 无线条 |


箭头线的宽度,指定为以磅为单位的正值。一磅等于 1/72 英寸。默认值为 0.5 磅。
版本历史记录
在 R2024b 中推出