yline
具有常量 y 值的水平线
语法
说明
yline(___, 使用一个或多个名称-值对组参量指定常量线属性。有关属性列表,请参阅 ConstantLine 属性。请在所有其他输入参量之后指定名称-值对组。Name,Value)
yl = yline(___) 返回一个 ConstantLine 对象或 ConstantLine 对象数组。使用 yl 修改或查询所创建的线条的属性。
示例
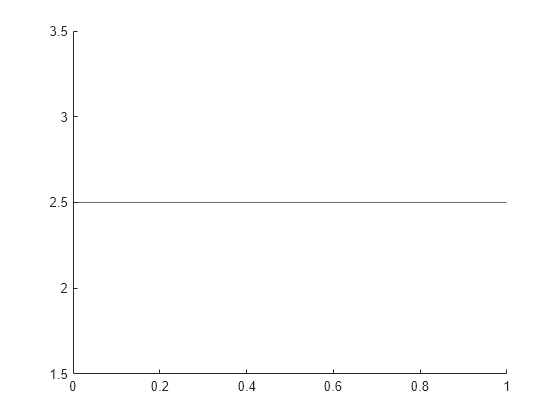
在 y = 2.5 处创建一条水平线。
yline(2.5);
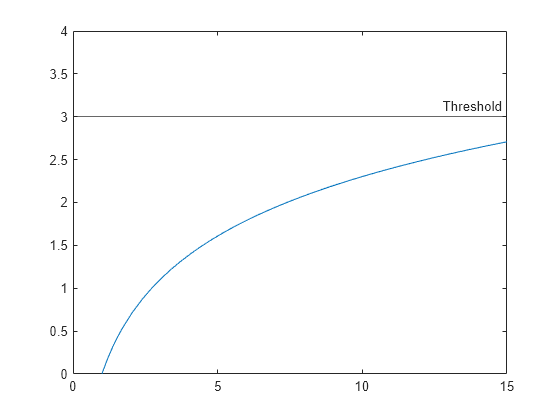
要创建一条具有标签的线条,还必须指定线型。默认线型是实线 '-'。
fplot(@(x) log(x));
xlim([0 15]);
ylim([0 4]);
yline(3,'-','Threshold');
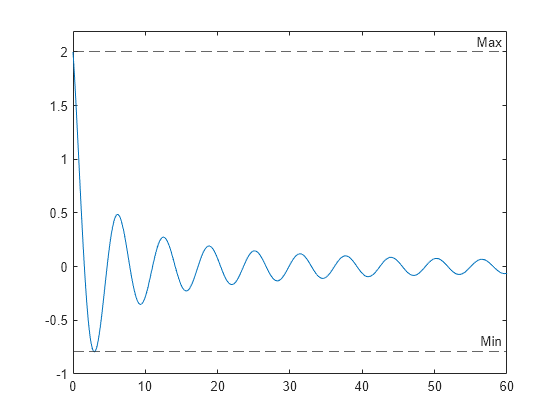
定义一组 x 和 y 向量并对其绘图。然后在最大和最小绘制值的上方和下方用额外空间填充 y 轴。
x = 0:0.1:60;
y = 4.*cos(x)./(x+2);
plot(x,y)
ylim padded
找到 y 的最大值和最小值。在这些位置创建带标签 'Max' 和 'Min' 的水平线。
ymax = max(y);
ymin = min(y);
yline([ymax ymin],'--',{'Max','Min'})
在 y = 4 处创建一条蓝色点划线。
yline(4,'-.b');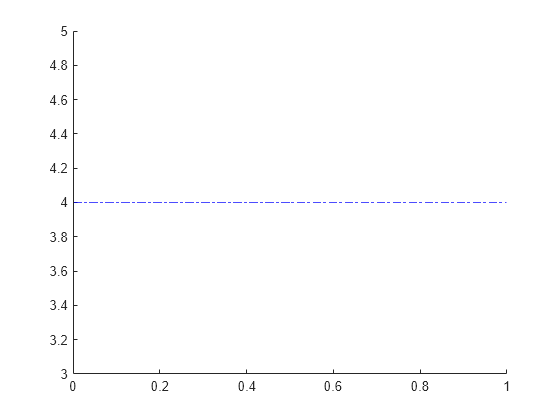
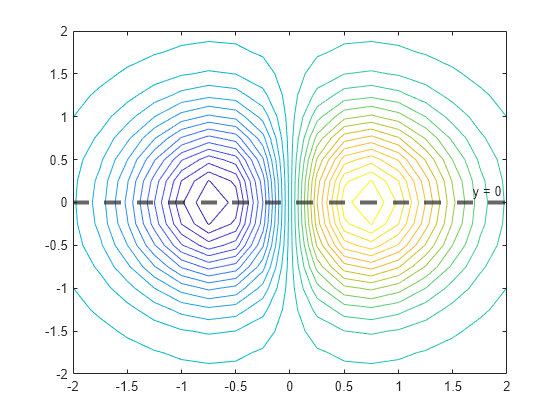
创建一条具有标签和指定线宽的水平虚线。
x = -2:0.25:2;
[X,Y] = meshgrid(x);
Z = X.*exp(-X.^2-Y.^2);
contour(X,Y,Z,30)

yl = yline(0,'--','y = 0','LineWidth',3);
更改标签的水平对齐方式和线条的颜色。
yl.LabelHorizontalAlignment = 'center';
yl.Color = [.80 0 .40];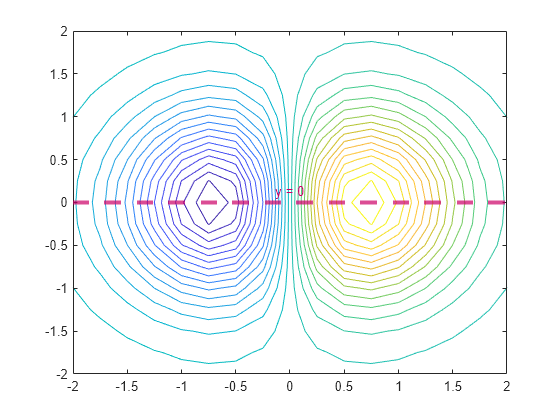
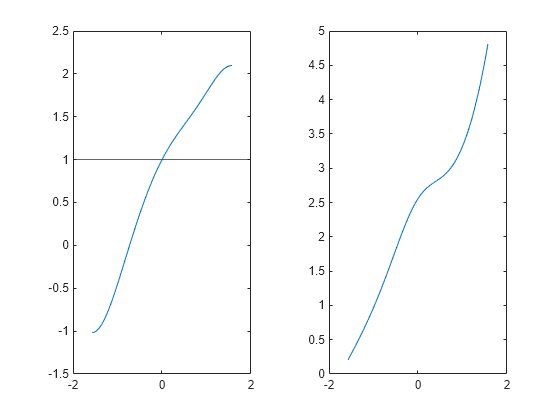
调用 tiledlayout 函数以创建 1×2 分块图布局。调用 nexttile 函数以创建坐标区对象 ax1 和 ax2。然后在每个坐标区中绘图。通过将 ax1 传递给 yline 函数,在第一个图中添加一条水平线。
tiledlayout(1,2)
ax1 = nexttile;
x = -pi/2:pi/60:pi/2;
y1 = tan(sin(x)) + cos(sin(x));
plot(ax1,x,y1)

ax2 = nexttile;
x = -pi/2:pi/60:pi/2;
y2 = tan(cos(x)) + exp(x);
plot(ax2,x,y2)

yline(ax1,1.0);
输入参数
y 坐标,指定为标量或包含数值、分类、日期时间或持续时间值的向量。y 的数据类型必须与 y 轴的数据类型匹配。
示例: yline(10) 在 y=10 处显示一条线。
示例: yline([13 20 33]) 在 y=13、y=20 和 y=33 处显示线条。
数据类型: single | double | int8 | int16 | int32 | int64 | uint8 | uint16 | uint32 | uint64 | logical | categorical | datetime | duration
线型和颜色,指定为包含字符和符号的字符向量或字符串标量。字符和符号可以按任何顺序出现。您可以指定线型和/或线条颜色。忽略 'o' 等标记符号。
示例: '--g' 表示绿色虚线。
| 线型 | 描述 | 表示的线条 |
|---|---|---|
"-" | 实线 |
|
"--" | 虚线 |
|
":" | 点线 |
|
"-." | 点划线 |
|


| 颜色名称 | 短名称 | 外观 |
|---|---|---|
'red' | 'r' |
|
'green' | 'g' |
|
'blue' | 'b' |
|
'cyan' | 'c' |
|
'magenta' | 'm' |
|
'yellow' | 'y' |
|
'black' | 'k' |
|
'white' | 'w' |
|


目标坐标区,指定为 Axes 对象。如果希望 yline 在当前坐标区以外的坐标区中绘图,请使用此参量。
行标签,指定为字符向量、字符向量元胞数组、字符串数组或数值数组。要创建一个多行标签,请使用字符串数组或字符向量元胞数组。
为一条线创建标签
指定一个字符向量或字符串标量来显示一行文本。要显示多行文本,请指定字符向量元胞数组或字符串数组。
| 表示形式 | 如何指定 labels | 示例 |
|---|---|---|
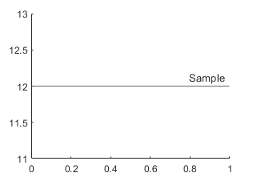
| 一行文本 | 指定一个字符向量或字符串标量。 |
yline(12,'-','Sample')
|
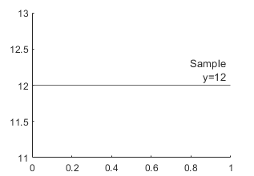
| 多行文本 | 指定一个字符向量元胞数组或字符串数组。数组中的每个元素是不同行的文本。 | yline(12,'-',{'Sample','x=12'})
|
为多行创建标签
指定一个字符向量或字符串标量,以便在所有行旁边显示相同的标签。指定一个字符向量元胞数组或字符串数组,为每行显示不同标签。
| 表示形式 | 如何指定 labels | 示例 |
|---|---|---|
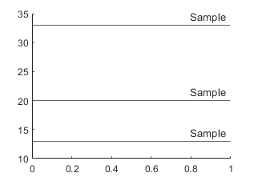
| 一个共享文本标签 | 指定一个字符向量或字符串标量。 |
yline([13 20 33],'-','Sample')
|
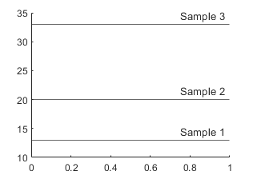
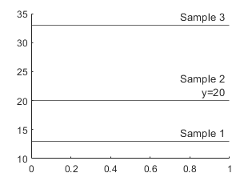
| 每行有不同标签 | 指定一个字符向量元胞数组或字符串数组。数组中的每个元素都是一个对应不同行的标签。labels 数组中的元素数必须与 x 的长度匹配。 | label = {'Sample 1','Sample 2','Sample 3'};
yline([13 20 33],'-',label)
|
| 不同的标签,部分标签有多行 | 创建一个字符向量元胞数组或字符串数组。使用 sprintf 函数在文本中插入换行符 ('\n')。 | label = {'Sample 1',sprintf('Sample 2\nx=20'),'Sample 3'};
yline([13 20 33],'-',label)
|
名称-值参数
将可选参量对组指定为 Name1=Value1,...,NameN=ValueN,其中 Name 是参量名称,Value 是对应的值。名称-值参量必须出现在其他参量之后,但对各个参量对组的顺序没有要求。
如果使用的是 R2021a 之前的版本,请使用逗号分隔每个名称和值,并用引号将 Name 引起来。
示例: yline(3,':','Median Price','LabelHorizontalAlignment','center') 将标签的水平对齐方式指定为 'center'。
注意
此处所列的属性只是一部分。有关完整列表,请参阅 ConstantLine 属性。
线条颜色,指定为 RGB 三元组、十六进制颜色代码、颜色名称或短名称。
对于自定义颜色,请指定 RGB 三元组或十六进制颜色代码。
RGB 三元组是包含三个元素的行向量,其元素分别指定颜色中红、绿、蓝分量的强度。强度值必须位于
[0,1]范围内,例如[0.4 0.6 0.7]。十六进制颜色代码是字符串标量或字符向量,以井号 (
#) 开头,后跟三个或六个十六进制数字,范围可以是0到F。这些值不区分大小写。因此,颜色代码"#FF8800"与"#ff8800"、"#F80"与"#f80"是等效的。
此外,还可以按名称指定一些常见的颜色。下表列出了一些命名颜色选项、其等效 RGB 三元组及十六进制颜色代码。
| 颜色名称 | 短名称 | RGB 三元组 | 十六进制颜色代码 | 外观 |
|---|---|---|---|---|
"red" | "r" | [1 0 0] | "#FF0000" |
|
"green" | "g" | [0 1 0] | "#00FF00" |
|
"blue" | "b" | [0 0 1] | "#0000FF" |
|
"cyan" | "c" | [0 1 1] | "#00FFFF" |
|
"magenta" | "m" | [1 0 1] | "#FF00FF" |
|
"yellow" | "y" | [1 1 0] | "#FFFF00" |
|
"black" | "k" | [0 0 0] | "#000000" |
|
"white" | "w" | [1 1 1] | "#FFFFFF" |
|
"none" | 不适用 | 不适用 | 不适用 | 无颜色 |
下表列出了浅色和深色主题中绘图的默认调色板。
| 调色板 | 调色板颜色 |
|---|---|
在 R2025a 之前的版本中: 大多数绘图默认使用这些颜色。 |
|
|
|


您可以使用 orderedcolors 和 rgb2hex 函数获取这些调色板的 RGB 三元组和十六进制颜色代码。例如,获取 "gem" 调色板的 RGB 三元组并将其转换为十六进制颜色代码。
RGB = orderedcolors("gem");
H = rgb2hex(RGB);
在 R2023b 之前的版本中: 使用 RGB = get(groot,"FactoryAxesColorOrder") 获取 RGB 三元组。
在 R2024a 之前的版本中: 使用 H = compose("#%02X%02X%02X",round(RGB*255)) 获取十六进制颜色代码。
示例: 'g'
示例: [0.6 0.2 0.5]
示例: '#D2F9A7'
线透明度,指定为 [0,1] 范围中的标量。值为 1 时不透明,值为 0 时完全透明。介于 0 和 1 之间的值表示半透明。
线宽,指定为以磅为单位的正值。
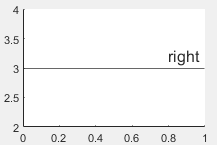
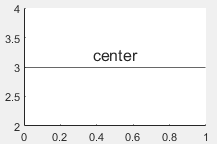
标签相对于线的水平对齐,指定为下表中的选项之一。
| 选项 | 描述 | 示例 |
|---|---|---|
'right' | 线的右侧 |
|
'left' | 线的左侧 |
|
'center' | 线的中心 |
|

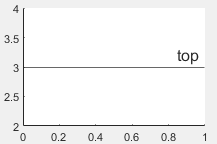
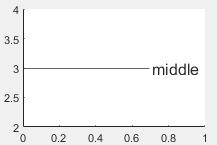
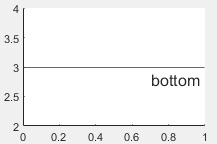
标签相对于线的垂直对齐,指定为下表中的选项之一。
| 选项 | 描述 | 示例 |
|---|---|---|
'top' | 线的顶部。 |
|
'middle' | 线的中间。标签将线分段。 |
|
'bottom' | 线的底部。 |
|
标签方向,指定为 'aligned' 或 'horizontal'。下表中显示了示例。
| 方向 | 描述 | 示例 |
|---|---|---|
'aligned' | 标签与指定线的方向相同。 |
|
'horizontal' | 无论线的方向如何,标签始终为水平方向。 |
|
算法
在坐标区的三维视图中,常量线出现在 z 坐标轴范围中点处的 x-y 平面中。如果坐标区旋转,则常量线会随之旋转。
版本历史记录
在 R2018b 中推出