Visualize and Record Data from Arduino Pins Using Arduino Explorer App
R2026bAfter you configure the pins of your Arduino board for communication with MATLAB as described in Set Up and Connect to Arduino and Arduino-compatible Boards Using Arduino Explorer, you can visualize data from the board.
Plot Data from Pins
The Plot tab of the app displays data from all read pins on the board as it is collected over time. You can customize this view.
To customize plot attributes such as the grid and axes, click Plot Settings.
Toggle visibility of signals in the plot by clicking signal in the legend.

View Data Log
The Log tab of the app provides a table with data communication information such as time stamp, type of operation, raw and decoded data values, and data size and type. This table is particularly useful when you are continuously reading data from communication protocol interfaces (I2C, SPI, and Serial).
By default, the Data column displays raw data as received from the pins. To display the data in a different format, such as hexidecimal, binary, or ASCII, use the Display Format menu.

The app also provides an option to export the entire log as a timetable into the Workspace. To do this, click Export Log in the Export section of the app.
Record Data
You can save data from the Arduino pins to a MATLAB workspace variable in two ways.
To export the current contents of the Log pane to the workspace, in the app toolstrip, click Export Log.
To record data from the pins to a workspace variable for a specified duration:
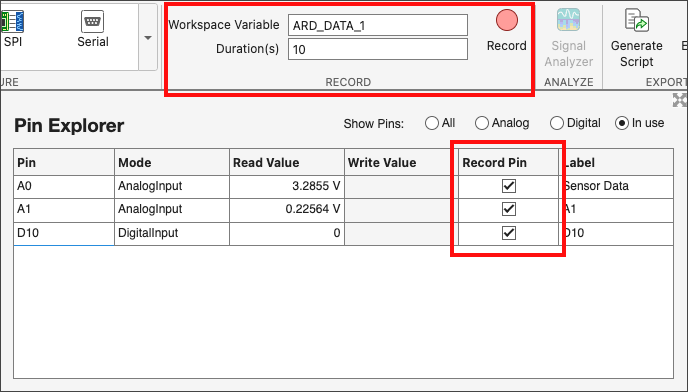
In the Pin Explorer pane, in the Record Pin column, select the pins you want to record.
In the toolstrip, specify the variable name and duration, and then click Record.
You can view the status of the data recording process in the status bar at the bottom of the app.

To stop recording before the specified duration elapses, in the app toolstrip, click Stop. Otherwise, recording continues until the duration elapses.
When recording ends, the app saves the data to the workspace as a timetable. The status bar updates.
After recording data, use the timetable in the workspace for further analysis. If you have a Signal Processing Toolbox license, you can open the Signal Analyzer app for further analysis by clicking Signal Analyzer in the Arduino Explorer toolstrip.
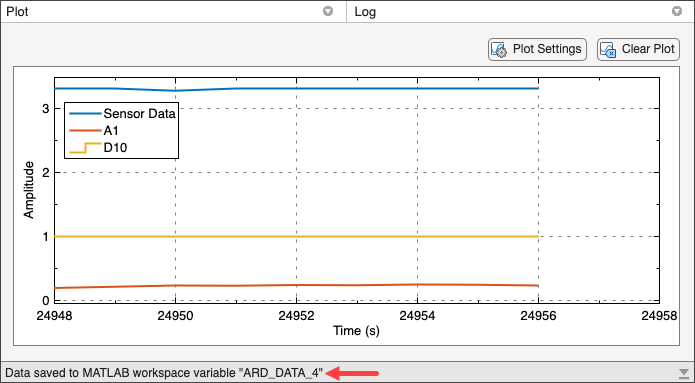
Once the data recording is complete, you can click Signal Analyzer in the Analyze section of the app to analyze the recorded data.
The app also provides an option to export the entire log as a timetable into the Workspace. To do this, click Export Log in the Export section of the app.
Generate MATLAB Script
To generate a MATLAB script containing the programmatic equivalent of your app session, in the app toolstrip, click Generate Script. Modify the script to create your own custom functions or applications.
Customizable Views in the App
You can customize some of the user interface elements in the app.
| User Interface Element | Customization |
|---|---|
| Pin Explorer |
|
| Pin Configuration, Plot, Log | Increase the panel area by maximizing the panel by double-clicking it and collapsing the other panels. |
| Legend | Drag the legend to change its location. |
| Plot Settings | Use the Plot Settings button to:
|
See Also
Topics
- Set Up and Connect to Arduino and Arduino-compatible Boards Using Arduino Explorer
- Visualize Pin Diagram Using Arduino Explorer App
- Configure Read and Write for GPIO Pins Using Arduino Explorer App
- Connect to SPI Device Using Arduino Explorer App
- Connect to I2C Device Using Arduino Explorer App
- Connect to Serial Device Using Arduino Explorer App

