Lookup Table Normalizers
What are normalizers? A normalizer is the axis of your lookup table. It is the same as the collection of the breakpoints in your table.
CAGE distinguishes between the normalizers and the lookup tables that they belong to. Using models to calibrate lookup tables enables you to perform analysis of the models to determine where to place the breakpoints in a normalizer. This is a powerful analytical process.
It is important to stress that in CAGE a lookup table can be either one-dimensional or two dimensional. One-dimensional tables are sometimes known as characteristic lines or functions. Two-dimensional tables are also known as characteristic maps or tables. This is important because normalizers are similar to characteristic lines.
For example, a simple strategy to calibrate the behavior of torque in an engine might have a two-dimensional lookup table in speed and relative air charge (a measure of the load). Also, this strategy might account for the factors of air/fuel ratio (AFR) and spark angle. Each of these compensating factors is accounted for by the use of a simple characteristic line. In CAGE, these characteristic lines are one-dimensional lookup tables. In the example strategy, there are the following lookup tables and normalizers:
One characteristic map: the torque table
Six characteristic lines:
Two tables: one for AFR and one for spark angle
Four normalizer functions: speed, load, AFR, and spark angle
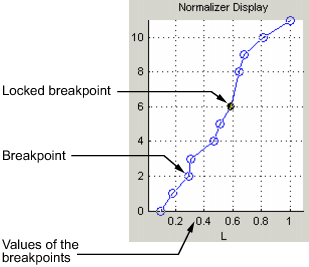
Notice also that a breakpoint is a point on the normalizer where you set values for the lookup table.
Thus, when you calibrate a normalizer you place the individual breakpoints over the range of the table axis.
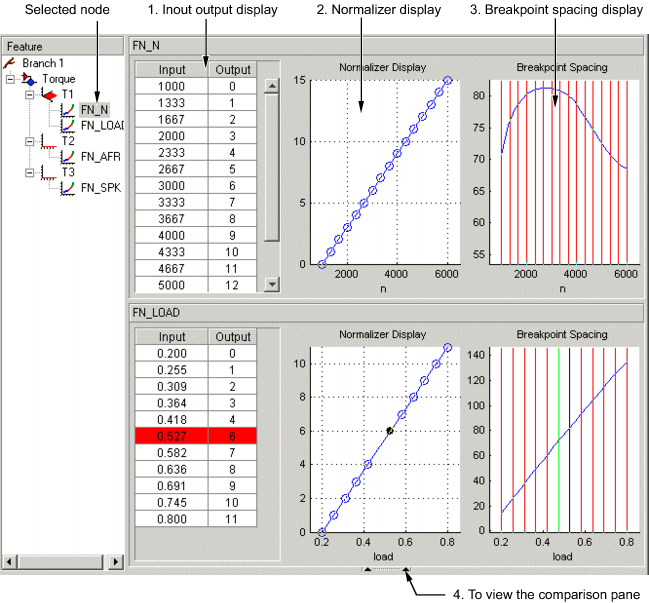
The normalizer node shows the Normalizer view, which displays:
Editing Breakpoints
To edit breakpoints:
Double-click a cell in the Input or Output column and edit the value.
Click and drag a breakpoint in the Normalizer Display graph or the Breakpoint Spacing display.
To view the history of the normalizer function, select View > History from the menu. This opens the History dialog box where you can view and revert to previous versions.
Locking and Unlocking Breakpoints
Locking breakpoints ensures that the locked breakpoint does not alter. You might want to lock a breakpoint when you are satisfied that it has the correct value.
To lock a breakpoint, do one of the following:
Right-click the selected breakpoint in the Input/Output display and select Lock. Locked breakpoint cells have padlock icons.
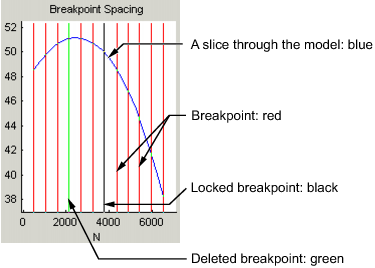
Right-click the selected breakpoint in the Normalizer Display or Breakpoint Spacing display and select Lock Breakpoint. Locked breakpoints are black.
Similarly use the right-click context menus to unlock breakpoints.
Deleting Breakpoints
Deleting breakpoints removes them from the normalizer lookup table. There are still lookup table values for the deleted breakpoints: CAGE determines the positions of the deleted breakpoints by spacing them linearly by interpolation between the non-deleted breakpoints.
Deleting breakpoints frees ECU memory. For example, a speed normalizer runs from 500 rpm to 5500 rpm. Six breakpoints are spaced evenly over the range of speed, that is, at 500, 1500, 2500, 3500, 4500, and 5500 rpm. If you delete all the breakpoints except the endpoints, 500 and 5500 rpm, you reduce the amount stored in the ECU memory. The ECU calculates where to place the breakpoints by linearly spacing the breakpoints between the 500 rpm breakpoint and the 5500 rpm breakpoint.
To delete a breakpoint, right-click the breakpoint and select Delete Breakpoint.
Deleted breakpoints are green in the Breakpoint Spacing display. You can restore them by right-clicking and selecting Add Breakpoint.
Input/Output Display
The lookup table consists of the breakpoints of the normalizer function.
The lookup table has inputs and outputs:
The inputs are the values of the breakpoints.
The outputs refer to the row/column indices of the attached lookup table.
To change values of the normalizers in the Input Output display, double-click a cell in the Input column and change its value.
Normalizer Display
This displays the values of the breakpoints plotted against the marker numbers of the lookup table (that is, the inputs against the outputs).
Click and drag the breakpoints to move them.
Breakpoint Spacing Display
The Breakpoint Spacing display shows
A slice through the model in blue (when feature calibrating regarding a model)
The breakpoints in red
To move breakpoints, click and drag.
Show Model Curvature
You might want to view the curvature of the model to manually move breakpoints to where the model curvature is greatest.
To display the model slice as its second-order derivative, the curvature of the model,
Right-click the model in the Breakpoint Spacing display and select Display > Model Curvature.
You can revert to displaying the model by selecting Display > Modelfrom the context menu.
Multiple Slice View
By default the Breakpoint Spacing display shows one slice through the model, shown.
Viewing many slices of the model gives a better impression of the curvature of the model. For example, see the following figure.
To view multiple slices through the model,
Right-click the model slice in the Breakpoint Spacing display and select Number of Lines and choose the number of slices that you want to view from the list.