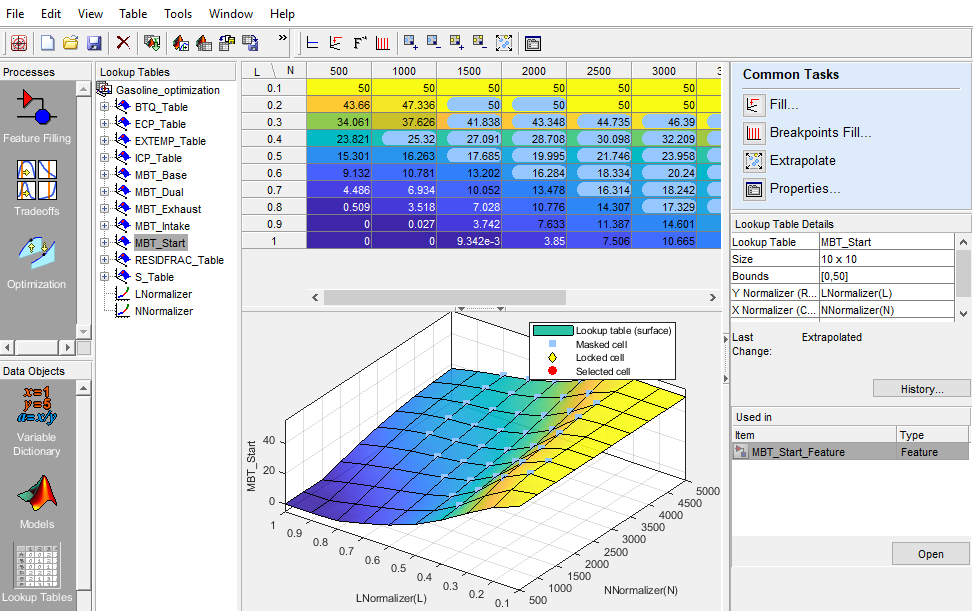
Edit Lookup Tables
When you select a table in the tree (under feature or tables), you see the Lookup Tables view.
In CAGE, a lookup table is defined to be either a one-dimensional or a two-dimensional lookup table. One-dimensional tables are sometimes known as characteristic lines or functions. Two-dimensional tables are also known as characteristic maps or tables. CAGE regards them both as similar objects.
Each lookup table has either one or two axes associated with it. These axes are normalizers.
For example, a simple MBT feature has two lookup tables:
A two-dimensional lookup table with speed and relative air charge as its normalizers
A one-dimensional lookup table with AFR as its normalizer
In the Lookup Table view:
| To | Action |
|---|---|
Fill the table. | On the Common Tasks pane, click Fill. For an example, see Fill a Single Lookup Table from a Model. |
Optimize the lookup table breakpoints. | On the Common Tasks pane, click Breakpoints Fill. |
Extrapolate the data. | On the Common Tasks pane, click Extrapolate. |
Edit the table properties. | On the Common Tasks pane, click Properties. |
Interactively change the smoothing factor when you fill lookup tables with models or data. | Use the Lookup Table Smoothing interactive control to adjust the smoothing factor. |
Edit a value in the lookup table. | Double-click the cell, then enter a value. You can right-click to Copy or Paste values. |
Help you relate the lookup table values to surface plots, the lookup table is shaded. Table cells background color matches the corresponding surface plot color. | Toggle lookup table shading with View > Shade Table. |
Match the orientation of the numerical lookup table. | Transpose the plot axes by right-clicking and selecting 2D Orientation X/Y. Switch back with 2D Orientation Y/X. |
View and revert table changes. | Click View History. Any locked cells and extrapolation mask cells are saved with lookup table history. |
The table displays the values of your lookup table and displays the breakpoints of the normalizers.
The table breakpoint values are not necessarily identical to the normalizer breakpoints. When you create a table, the breakpoint values are the same as the normalizer values. If you delete breakpoints from the normalizers the table size does not change, so the table column and row breakpoint values are interpolated between the remaining normalizer breakpoints.
Add, Duplicate, and Delete Tables
To quickly create lookup tables from a model, use the lookup table creation wizard. To add tables, select the Lookup Tables view, or CAGE automatically switches to this view if you add a table using the File > New menu items.

The Lookup Tables view lists all the tables and normalizers in the current CAGE session.
| To | Action |
|---|---|
Add a lookup table to a session: |
|
Copy a table or a normalizer from a session. |
|
Delete a table or a normalizer from a session. When you are calibrating a collection of lookup tables using either Feature or Tradeoff calibrations, you cannot easily delete tables without affecting the entire calibration. When deleting items, you must delete from the highest level down. For example, you cannot delete a table that is part of a feature; you must delete the feature first. |
|
Fill Tables by Extrapolation
Filling a table by extrapolation fills the table with values based on the values already placed in the extrapolation mask.
To fill a table by extrapolating over a preselected mask, click
![]() or select Table > Extrapolate. Alternatively, on the Common Tasks pane, click
Extrapolate.
or select Table > Extrapolate. Alternatively, on the Common Tasks pane, click
Extrapolate.
This extrapolation does one of the following.
| If Extrapolation Mask Has | Action |
|---|---|
Points on a line. | CAGE performs linear extrapolation on points projected on to that line. The simplest case of this is when you try to fill a 2-D table using data from a single row or column. |
Points on a plane. | CAGE uses the plane for extrapolation. The simplest example is when the mask has three points and the points are not on a line. |
Four or more ordered cells in a grid | CAGE uses bilinear extrapolation. |
Four or more cells not on a grid, | CAGE uses a thin plate spline to extrapolate the table values. |
To ensure that tables extrapolate smoothly to locked cell values, CAGE includes the locked cells in the extrapolation even if the cells are not part of the extrapolation mask.
Extrapolation Masks
The extrapolation mask defines a set of cells that form the basis of any extrapolation. For example, a speed-load (or relative air charge) table has values in the following ranges that you consider to be accurate:
Speed 3000–5000 rpm
Load 0.4–0.6
To add or remove a cell from the extrapolation mask:
Right-click the table.
Select Add To Extrapolation Mask or Remove From Extrapolation Mask from the menu.
Cells included in the extrapolation mask are colored blue. Cells that are locked and in the extrapolation mask are blue and have a padlock icon.
Use the Table menu for these options:
| Menu | Action |
|---|---|
| Table > Extrapolation Mask | Use options to add, remove, clear, copy, and convert masks. |
Table > Extrapolation Mask > Generate From PEV | Generates extrapolation mask depending on the value of prediction error (PEV). A dialog box opens where you can specify the threshold value of PEV below which you want to include cells in the mask. To help you select a threshold, the dialog box contains information about the range and prediction error mean for the model. |
| Table > Extrapolation Mask > Generate From Boundary Model | Generates extrapolation mask to include only cells within the boundary model. |
| Table > Extrapolation | Extrapolates values from the cells in the extrapolation mask to fill the whole table. |
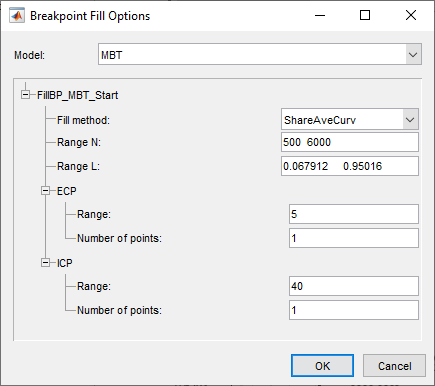
Optimize Lookup Table Breakpoints
On the Lookup Table view Common Tasks pane, select Breakpoints Fill. On Breakpoint Fill Options dialog box, use the Model parameter to specify the model that you want to use for the optimization. Specify the other fill options.
Click OK.
To help you update the lookup tables with the new breakpoints from the optimization results, use the Update Lookup Tables.
On the Update Lookup Tables dialog box, update the tables with new breakpoints from the optimization results and feature fill settings. Click Start.
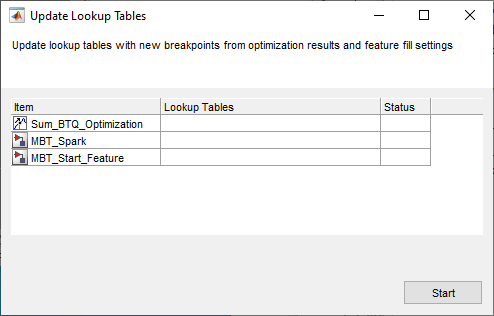
The dialog box provides the status of the lookup table updates.

Lock Lookup Table Values
When you are satisfied with an area of the table, you might want to lock the cell values, to ensure that those values do not change.
To lock or unlock a cell value, right-click the cell and select from the menu. Locked cells have a padlock icon in the display. You can also lock an entire table or copy locks from other tables.
Use the Table > Table Cell Locks menu options to lock, unlock, copy, or convert selected or all the cells in the table.
Edit the Lookup Table Graph
The Lookup Tables view displays both the lookup table values and a graph of the lookup table. This gives a useful display of the table behavior. Use the View options to edit and alter the table views.
Arithmetic Operations on Lookup Table Values
The Table > Adjust Cell Values menu option opens a dialog box where you can specify an arithmetic operation to apply to either the whole table or only the cells currently selected. Arguments to operations can be numeric (plus 10) or percentages (minus 5%). You can set the selected cells to a value or to the mean. You can also apply user-defined functions.
Right-click the table or select Table > Adjust Cell Values. The Adjust Cell Values dialog box appears.
Select the operation to apply. Use the custom operation to specify your own function in a file.
Use the Value edit box to enter an argument. All operators accept a numeric argument (e.g. operator =
plus, value =10). You can also enter a percentage for the operators plus, minus, and set to value (e.g. `minus'`1%').Select the radio buttons to apply the operation to either the whole table or only the cells currently selected, and click OK.
You can use the custom operation option to apply user-defined functions. For example, use this to call the custom function:
newvalues = customfcn( currentvalue, selectedregion )
currentvalue— Matrix of table values andselectedregionis a logical matrix the same size as the table.newvalues— Matrix should be the same size ascurrentvalue, and these numbers are put straight into the table.
For example:
function table = addOne( table, region )
table(region) = table(region) + 1;
return;

function table = randomtable( table, region )
table( region ) = rand( nnz( region ), 1 );

function table = saturate( table, region )
maxValueAllowed = 150;
table( region & table>maxValueAllowed ) = maxValueAllowed;
minValueAllowed = 100;
table( region & table<minValueAllowed ) = minValueAllowed ;
return
To use the saturate example:
Save the function text in a file named
saturate.m.Click and drag to select a region of cells in a CAGE table.
Right-click and select Adjust Cell Values.
In the dialog box:
Select
custom operationfrom the Operation listEnter
saturatein the Value edit box or click the browse button to locate the file.Select the option button to Apply to selected table cells, and click OK.
The selected table cells are saturated between the ranges specified in the function file (between 100-150).