Set Up Data Sets
How to Set Up Data Sets
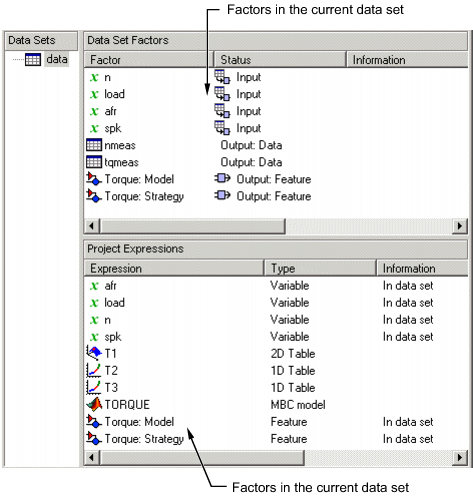
The Data Sets view displays the strategies,
tables, and models, etc., as a list of factors in the default
Data Set Factors view. You can also
display the same factors as columns in a grid, with all factors
displayed as columns in the list, by selecting the View Data toolbar
button (![]() ). The data set works over a grid of values,
which is not necessarily the same as the normalizers of any included
tables in the data set.
). The data set works over a grid of values,
which is not necessarily the same as the normalizers of any included
tables in the data set.
You have to set the input factors and their values to define the grid in the data set. You can do this in one of these ways:
Import experimental data from file. See Importing Experimental Data from File.
Import data from the Model Browser. See Importing Data from the Model Browser.
Import the values from a table in your CAGE session. See Importing Data from a Table in Your Session.
Merge data sets that share the same factors. See Merging Data Sets.
Specify the factors and their values manually. See Specifying the Factors Manually.
The next sections describe each of these in detail.
Importing Experimental Data from File
You can import experimental data to a data set, either to validate a calibration or to use it as the basis for a calibration.
You can import data that is stored in the following formats:
Microsoft® Excel® spreadsheets
Comma-separated value files
MAT files
Data in the Model Browser
Data Format for Importing from Excel or Comma-Separated Value
When you import data from either a Microsoft Excel spreadsheet or from a comma-separated value file, you must ensure that the data is organized in the following manner:
The first row can either be column headers (text) or entries (numbers).
The second row can be a row of units (text), as for importing into the Model Browser. CAGE ignores this row.
All the other row and column entries must be numbers.
Note
The Data Editor can create a tailor-made Excel sheet for you to fill with data and then import. This sheet will be in the format the Model-Based Calibration Toolbox™ product expects to import data. See Tailor-Made Excel Sheets in the Model-Based Calibration Toolbox Model Browser User's Guide.
Importing from MAT files
When you import from a MAT file, you must ensure that the file contains numbers only, that is, a double array.
To import experimental data:
Select File > New > Data Set to create an empty data set.
Select File > Import > Data > File.
In the file browser, select the correct file to import. This opens the Loading Data from
MAT-filenamedialog box. Use this dialog box to select the data in the MAT file you want to import into the data set. Click OK.This opens the Data Set Import Wizard.
Discard any columns of data you do not want to import by selecting the column and clicking the button shown.

Click Next.
The following screen asks you to associate variables in your project with data columns in the data.
Highlight the variable in the Project Assignments column and the corresponding data column in the Data Column, then click the assign button, shown.

Repeat step 5 until you are satisfied that you have associated all the variables and data columns. Any unassigned data columns are treated as output factors.
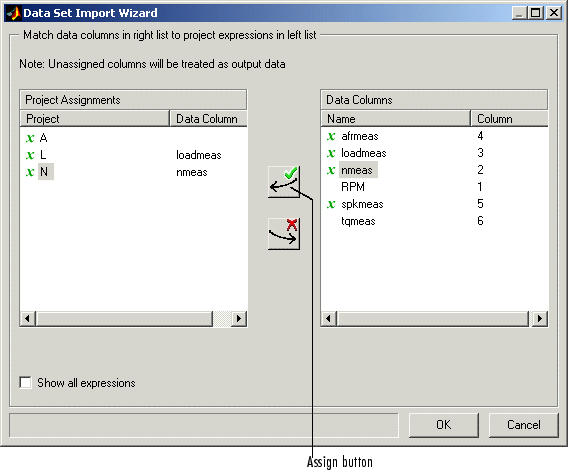
Click Finish to close the dialog box.
CAGE imports your data and you can view your data set.
Importing Data from the Model Browser
You can import data sets from a project currently loaded in the Model Browser.
To import data from the Model Browser:
Select File > New > Data Set to create an empty data set.
Select File > Import > Data > Model Browser.
In the dialog box, select the correct data set in the current Model Browser project to import.
The Data Set Import Wizard opens.
Select the data columns that you want to import into the data set. Exclude any columns of data you do not want to import. To so, select the column and click the button shown.
If your project is empty, you can click OK to import your selections. Otherwise, click Next.
On the next screen, highlight variables in the Project Assignments column to associate variables in your project with data columns in the data. Then, highlight the corresponding data column under Data Column, and click the assign button.
Click Finish to close the wizard and import the data.
See also Export Data Sets.
Importing Data from a Table in Your Session
To import data from a table:
Select Data > Import > Import from Table.
If your data set already contains data, a dialog box asks whether you want to Fill the data set from the table or Overwrite the data set from the table.
Select Fill to use the table values to fill the factors in your data set.
Select Overwrite to disregard all factors in your data set and fill the data set with the input and output factors from the table.
A dialog box opens.
Select the correct table from your session to import, and click OK.
When you have imported your data, you can view the data set.
Merging Data Sets
To merge another data set in your project with the currently selected data set:
Select Data -> Import -> Merge Data Set.
The Merge Data Sets dialog box appears containing a list of all data sets in your project.
Select the data set you want to merge with the current data set, and click OK.
Columns of inputs and external data are appended to columns with names that match in the current data set.
Outputs (models) and any other columns without matching names are not merged.
The values for any unmatched columns are set to the set point if possible, or zero otherwise.
Specifying the Factors Manually
Select the Data Set view by clicking the large Data Sets button in the Data Objects pane.
Add a data set to the project by selecting File -> New -> Data Set.
Select the factors. (See Selecting the Factors.)
Build the grid. (See Manually Setting Values of the Input Variables.)
After you complete these steps you can view the data set.
This section describes
Selecting the Factors
Clicking the Factors View button in the toolbar
(![]() ). This displays two list boxes.
). This displays two list boxes.
The upper list shows all factors within the data set. You can sort factors by clicking the column headings.
The lower list shows CAGE project expressions.
You can use this view to add factors to or remove factors from the data set.
To add a factor to a data set,
Right-click a factor and select Add to Data Set from the context menu.
Alternatively, select the factor or factors that you want to add to the data set from the list in the lower Project Expressions pane, then select Data > Factors > Add to Data Set.
To make multiple selections, use the standard Shift+click or Ctrl+click.
To remove a factor from a data set,
Select the factor or factors that you want to remove from the data set.
Right-click and select Remove from Data Set, or select the menu item Data -> Factors -> Remove From Data Set.
Note
Links between the two lists are always preserved, so clicking load in the upper list also selects load in the lower list. In other words, you can copy or remove from either list and the relevant results appear in both.
Manually Setting Values of the Input Variables
Clicking the Build Grid toolbar button (![]() ) or selecting Data > Build Grid enables you to set the values of the input
variables for the data set.
) or selecting Data > Build Grid enables you to set the values of the input
variables for the data set.
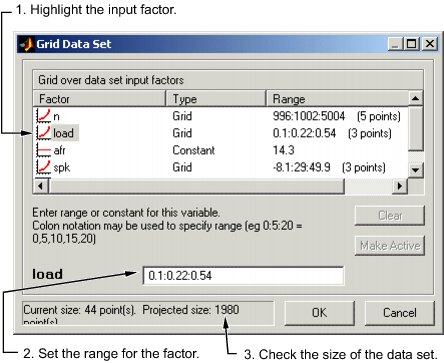
To build a full factorial grid,
Select Data > Build Grid.
Select the factor that you want to define a grid for.
Set the grid for the factor.
To set a grid of 5, 10, 15, 20, 25, 30, input the following:
5:5:30, where the first number is the minimum, the second is the step size, and the last number is the maximum value.Check the size of the data set in the pane. The current size reported at the bottom of the dialog box is the size if you click Cancel to leave the data set unchanged. The projected size is created if you click OK. In the following example, the projected size of
45you can see is obtained by multiplying the number of points for each factor with a grid (in this case, 3 * 5 * 3).Select the next factor that you want to define a grid for.
When you have set the grids for all the factors, click OK.
Creating a Factor from the Error Between Factors
To create a factor that is the difference between two other factors,
Highlight the two factors, using Ctrl+click or Shift+click.
Select Create Error from the right-click menu on either column head.
This creates a new factor that is the difference between the two other factors.