Determine Nonlinear Behavior of PMSM Using Characterization Test Data
This example shows how to determine the drive characteristics and optimal reference currents for a nonlinear permanent magnet synchronous motor (PMSM) from measured or simulated data.
In high-performance PMSMs, particularly in demanding applications such as electric vehicle traction, the assumption of constant electrical parameters (known as lumped parameters) is often inaccurate. Therefore, to ensure that the control model behaves realistically and operates optimally, you must identify the motor’s nonlinear characteristics and capture the varying behavior of the parameters.
At high load or high speed, the d-axis (id) and q-axis (iq) currents may cause saturation of the magnetic flux density in the iron core. When saturation occurs, the motor's key electrical parameters (inductances or flux linkages) change. To capture this varying behavior accurately, represent the motor parameters by 2D maps or look-up tables (LUTs) that give the flux linkage or inductance as a function of id and iq.
This example helps you compute LUTs for d and q axes reference currents, also referred as optimal reference current LUTs, as a function of motor speed and load torque, The example uses the LUT based PMSM Control Reference block. A plant model loads the input LUTs and simulates the motor dynamics.
To calculate the optimal reference current at a given speed and torque, you need the input voltage along with the input LUTs. You can provide the required data from the physical measurements (such as dyno tests) or virtual dyno or Finite Element Analysis (FEA) simulations.
This figure shows the various methods of obtaining input data that characterize the motor and the process to generate the optimal reference currents for operating the motor with the lowest copper losses. Use these values in a motor system model, which can then further be deployed to a microcontroller through code generation workflow.
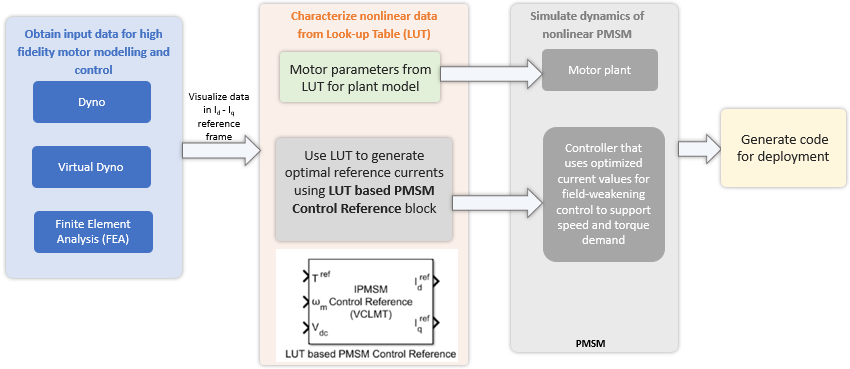
The characterization data in the form of measurement values or characterization tables is further processed to get a smooth 2-D function for the data (flux linkage tables) in terms of operating currents and . The preprocessed motor's characterization data is provided to the motor plant in the system simulation model, and the generated optimal reference currents are provided for the controller. This model is useful for simulating the control behavior of the system, and also for generating the embedded code for the target hardware system.
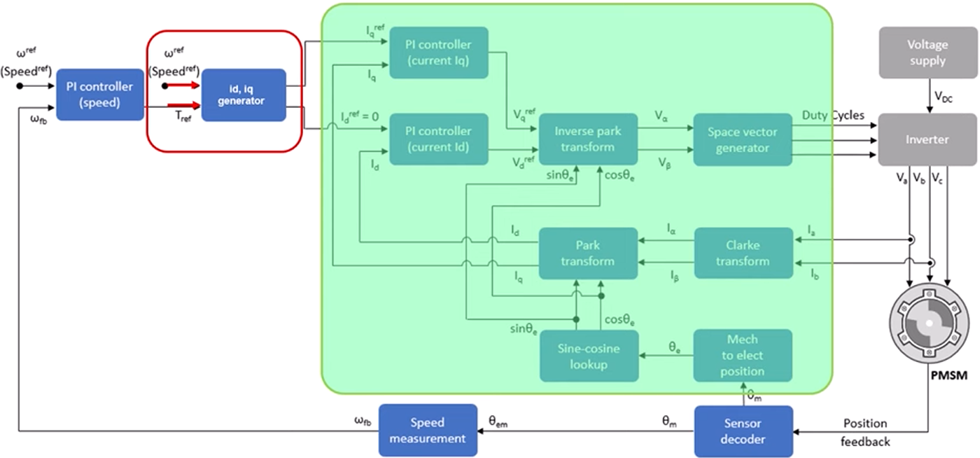
In the deployed Field-Oriented Control (FOC) algorithm, the process is instantaneous:
Inputs: The controller receives the real-time motor speed () and the torque reference () from the outer control loop.
Look-Up and Interpolation: The controller uses these two values to look up and in the pre-computed tables. If the operating point falls between grid points, the controller uses linear interpolation between the four neighboring points to find a smooth, accurate value.
FOC: The resulting and are fed directly to the inner current control loops (PI controllers), completing the FOC reference generation.
This figure shows the complete implementation of FOC using nonlinear characterization of data in terms of operating currents and . The PI controllers in the inner current loop uses and generated using the look-up table.
Nonlinear Characterization Workflow Steps
To create a motor characterization data for a PMSM, this example guides you through a structured workflow that involves importing raw data, processing it into surface maps, and visualizing the motor's operational boundaries.
Import and Process Data: Gather voltage, current, speed, and torque data from physical measurements, dyno tests or FEA simulations. Use Clarke and Park transforms to convert stationary frame data to the d-q frame and calculate flux linkages based on motor resistance and speed
Generate Surface Maps: Create smooth surface maps for flux and torque. These maps are essential for capturing the motor's non-linear behavior
Define Operating Grids, Visualize Drive Characteristics, and Calculate Optimal LUTs: Establish speed and torque breakpoints to define the lookup table range. Visualize hardware limits using constraint curves and determine the optimal reference currents for every grid point
Prepare Model and Verify Using Simulation: Load the generated lookup tables into a LUT-based PMSM Control Reference block within a simulation model. Verify that the calculated currents achieve the desired motor dynamics and performance under Field-Oriented Control.
Click the text in each box in the below flow chart for more details.
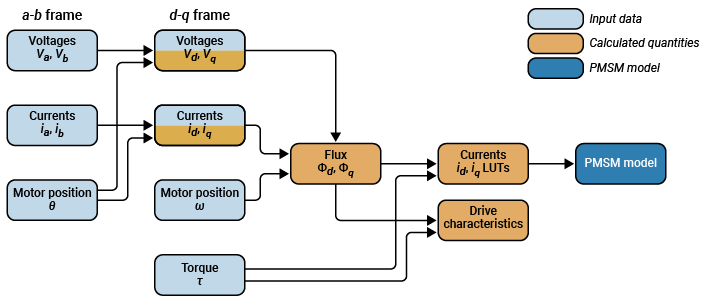
This figure shows the type of input data and the calculated quantities that are used to complete the workflow that creates the PMSM model.
Supporting Files for Preparing Characterization Test Data and Generating Model
To copy the example and supporting files onto your system, click the Copy Command button and then paste the copied command in the MATLAB Command window. The files are referenced in the workflow steps:
References
[1] "Designing a Torque Controller for a PMSM through Simulation on a Virtual Dynamometer" Accessed March 27, 2025. https://www.mathworks.com/company/technical-articles/designing-a-torque-controller-for-a-pmsm-through-simulation-on-a-virtual-dynamometer.html
[2] "Calibrating Optimal PMSM Torque Control with Field-Weakening Using Model-Based Calibration" Accessed March 27, 2025. https://www.mathworks.com/company/technical-articles/calibrating-optimal-pmsm-torque-control-with-field-weakening-using-model-based-calibration.html
See Also
LUT based PMSM Control Reference | PMSM Constraint Curves and Their Application