Mixed-Signal Analyzer
Analyze circuit simulation data
Description
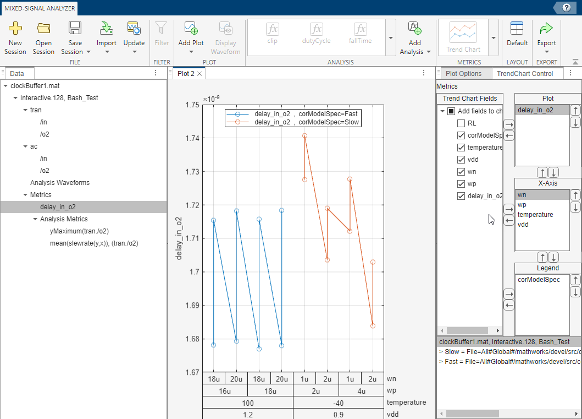
The Mixed-Signal Analyzer app enables you to visualize, analyze, and identify trends in mixed-signal simulation data. With the Cadence® Virtuoso ADE-MATLAB® Integration option you can import databases of circuit-level simulation results in MATLAB. To gain insights into the data, you can plot trends where you can vary different process parameters and see how the system behavior changes. You can compare the simulation results between different simulation runs and save and export your results.

Open the Mixed-Signal Analyzer App
MATLAB Toolstrip: In the Apps tab, under RF and Mixed-Signal, click the app icon.
MATLAB command prompt: Enter
mixedSignalAnalyzer.
Examples
Programmatic Use
mixedSignalAnalyzer opens a new blank Mixed-Signal
Analyzer app.
mixedSignalAnalyzer('<fileName.fileExtension>') starts the
Mixed-Signal Analyzer app, and loads it with the simulation data from the
<fileName> file. The app supports .csv,
.xlsx, and .mat files.
More About
You can extract simulation data from Cadence ADE Simulation run (Interactive or Ocean). You can save data from a specific simulation run or all simulation runs. The intermediate waveforms generated by the SKILL expressions and signal with alias names are also saved in a folder.
Simulation data are saved in a .mat file.
You can first extract the data from Cadence to a .mat file, then launch the Mixed-Signal
Analyzer app. This allows you to run the app from any operating system: Linux®, Windows®, or Mac. For more information, see Export Cadence® Simulation Data to MAT File.
Alternatively, you can export the data from Cadence directly in the Mixed-Signal Analyzer app. This allows you to export multiple interactive runs at the same time. But you must be in the Linux environment. For more information, see Import Cadence® Database to Mixed-Signal Analyzer.
When extracting data from Cadence, you can select what type of data to extract:
Only metrics data.
Metrics data, selected probed signals, and all expression-based waveforms.
Metrics data and all waveform data.
Note
Currently the Mixed-Signal Analyzer app supports extracting the
tran,dc,ac, and
stb analysis data from Cadence runs.
You can import simulation data to Mixed-Signal Analyzer app in three ways:
Import data from a
.csv,.xlsx, or.matfile. The.csvand.xlsxfiles must contain only metrics data (no waveform data). The.matfile can contain only simulation data (generated fromadeinfo2msa) or the data from a previous saved app session (session.matfile).Import data from a table in the MATLAB workspace.
Import data from Adeinfo database.
To import data from Adeinfo database, use the adeinfo2msa function.
The function extracts the Cadence simulation information, converts the data to a .mat file,
then launches the Mixed-Signal Analyzer app with the generated
.mat file.
You can select to import only the metrics data for faster performance. When you select
to import the waveform data as well, you can select only the probed signals you are
interested in. All expression-based waveform data are also imported if you select to import
waveform data. The waveform data are saved in a folder with multiple .mat
files.
You can define which type of run result to process (Interactive or Ocean), the
simulation run name, and the test name mentioned in Cadence ADE Maestro view. You can also specify the file name of the
.mat file to be generated. For more information, see adeinfo2msa.
Use the Mixed-Signal Analyzer to perform various analysis to get a better understanding of the system. Supported built-in analysis functions are:
| Analysis Function | Description |
|---|---|
clip | Return the portion of a signal between two specific points along the x-axis. |
dutyCycle | Return the duty cycle of a waveform. |
fallTime | Return the fall time value of a waveform. You must specify the upper and lower limits to measure the fall time. |
phaseNoise | Return the phase noise of a signal. You must specify the resolution bandwidth and the frequency offset points. If the frequency offset points are specified as a scalar, the resulting phase noise is displayed under Analysis Metrics in the Data panel. If the frequency offset points are specified as a row vector, the resulting phase noise is displayed under Analysis Waveforms in the Data panel. |
powerSpectrum | Generate power spectrum from time domain data. |
riseTime | Return the rise time value of a waveform. You must specify the upper and lower limits to measure the rise time. |
xMaximum | Return the highest value along the y-axis. |
xMinimum | Return the lowest value along the y-axis. |
yMaximum | Return the highest value along the y-axis. |
yMinimum | Return the lowest value along the y-axis. |
You can also add your custom analysis using the Add Analysis button. This opens the Mixed-Signal Analyzer - Add Analysis dialog box. You can create custom analysis function in two ways:
Enter a MATLAB expression. You can use any built-in MATLAB function available to you.
You can also access your saved expressions by clicking the Manage Saved Expressions button.
Create your own custom MATLAB function. You can also define numeric parameters that can be entered manually during the runtime using the Parameter prompts option. You can access your custom functions by clicking the Open Existing button.
Note
You must enter one numerical parameter prompt per line.
For more information, see Add Custom Analysis Functions.
You can access your saved custom functions by clicking the arrow beside the Add Analysis button in the add toolstrip, then clicking the Open Analysis Function button.
Note
The custom analysis functions are saved in the \msblks\+msaCustom
folder in your preferred directory. You can find your preferred directory using the
prefdir command in the MATLAB command window.
The app supports analysis of both current and voltage signals. You can also combine different simulations results such as data with only waveforms, only metrics, or a combination of both.
Note
If you create a custom analysis by writing a MATLAB function of your own, that custom analysis is not included when you generate a script using the Export To Script button.
You can focus on the waveforms and metrics you are interested in by filtering out the unwanted data nodes.
To filter out the waveform and metrics nodes before plotting them, select the waveform or metrics in the Data panel, then click the Filter button in the app toolstrip. This actions removes the deselected nodes from the plots altogether, reducing the number of cases plotted. To undo this action, you have to create a new plot.
To filter out parameters from a plot, click the Filter... button in the Plot Options panel, then deselect the nodes you want to filter out. This removes the deselected nodes from the current plot from now. You can bring back the nodes any time by clicking the Filter... again and reselecting them. You can also filter out datasets from the trend chart.
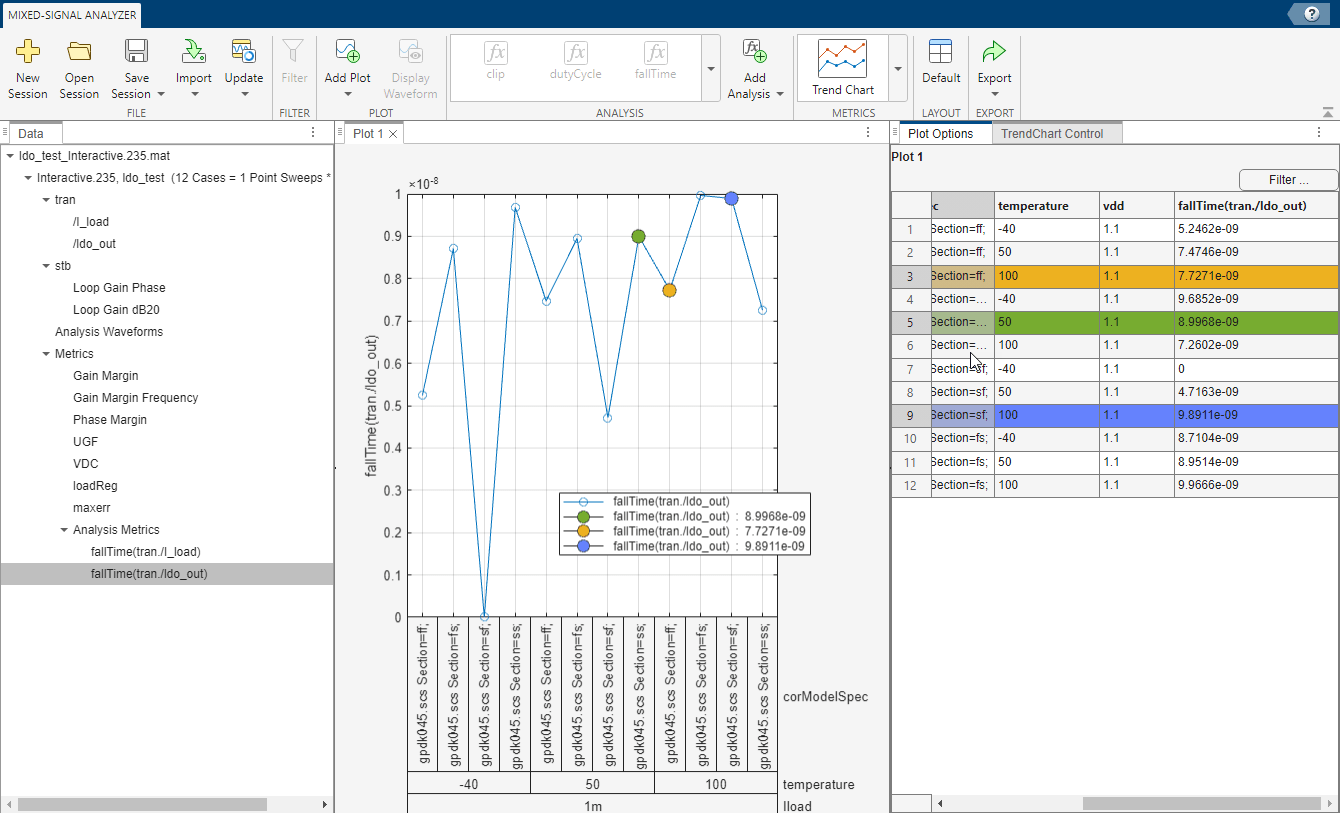
The Mixed-Signal Analyzer app reports the analysis results and metrics both as a plot and a metrics table in the Plot Options panel. If you select any data point in the figure, the corresponding data point in the metrics table is highlighted. Alternately, if you select any data point in the metrics table, the corresponding data point in the plot is highlighted.
You can select multiple data points and add legends to gain insight into their correlation. To select multiple data sets, hold the CTRL or the SHIFT button in your keyboard while selecting the data points.

This allows you to easily map the data point in the figure to the data point in the metrics table for better insight about your design.
You can update a waveform file in the current session with a similar waveform file by clicking the Update button in the app toolstrip. To match the waveforms in the current session versus those in the updated file, you must ensure that both the current session and updated file has the:
same simulation type (transient, AC, or DC),
same node name (for example,
/ldo_out),and same corner name and associated datapoint number (for example,
C1_0<DataPoint>1).
To customize the plots display, right click on the inactive area of the plot. This allows you to customize the text font, style, and size. You can customize the fonts for x and y axes, and the legends (trend chart only).
To export the data generated in a Mixed-Signal Analyzer app session using a automatically generated MATLAB script, select Export > Export To Script button from the app toolstrip. The script contains the data source, waveform data, and any plots you created during the session.
This script allows you to programmatically access the data from the command window. You can process and analyze the data and customize the plots in any way you need. You can also simply update the data source in the script and plot relevant results independent of the Mixed-Signal Analyzer app.
Note
If you create a custom analysis by writing a MATLAB function of your own, that custom analysis is not included when you generate a script using the Export To Script button.
You can export the analysis results from the app as a report in either ppt, pdf, doc, or
html file format. You can also rename each plot for your convenience while generating the
report using the Add Plot > Rename Plot option
from the app toolstrip. You can also select the format, name, and location of the report
file. By default, the report is saved in the maestro/documents folder of
the design.
The report contains the details about the Cadence project such as the test interactive run number and the data file source which is used to generate the results. It lists the corner information and global and design variables. It also contains the plots which open in the session when the report is generated.
Version History
Introduced in R2021aYou can select which probed signals you want to extract from Cadence. All the expression-based waveform data are also imported.
You can now plot the metrics and waveform data of an adeInfo object
directly from the MATLAB without launching the app. For more information, see adeDataReader
MATLAB Command
You clicked a link that corresponds to this MATLAB command:
Run the command by entering it in the MATLAB Command Window. Web browsers do not support MATLAB commands.
选择网站
选择网站以获取翻译的可用内容,以及查看当地活动和优惠。根据您的位置,我们建议您选择:。
您也可以从以下列表中选择网站:
如何获得最佳网站性能
选择中国网站(中文或英文)以获得最佳网站性能。其他 MathWorks 国家/地区网站并未针对您所在位置的访问进行优化。
美洲
- América Latina (Español)
- Canada (English)
- United States (English)
欧洲
- Belgium (English)
- Denmark (English)
- Deutschland (Deutsch)
- España (Español)
- Finland (English)
- France (Français)
- Ireland (English)
- Italia (Italiano)
- Luxembourg (English)
- Netherlands (English)
- Norway (English)
- Österreich (Deutsch)
- Portugal (English)
- Sweden (English)
- Switzerland
- United Kingdom (English)