show
Description
show(
specifies one or more options using one or more name-value arguments.mTSDF,Name=Value)
h = show(___)
Examples
Create two collision boxes and one collision sphere. The collision boxes represent a static environment and the sphere represents a dynamic obstacle with a pose that could change at any time.
box1 = collisionBox(0.5,1,0.1);
box2 = collisionBox(0.5,0.1,0.2,Pose=trvec2tform([0 -0.45 0.15]));
sph = collisionSphere(0.125,Pose=trvec2tform([-0.1 0.25 0.75]));
showCollisionArray({box1,box2,sph});
title("Static Environment and Dynamic Obstacle")
v = [110 10];
view(v);
Create a mesh TSDF manager with a resolution of 25 cells per meter.
tsdfs = meshtsdf(Resolution=25);
To improve the efficiency of signed distance field computation, combine meshes that represent the static environment.
staticMeshes = geom2struct({box1,box2});
staticEnv = staticMeshes(1);
staticEnv.Pose = eye(4);
staticEnv.Vertices = [];
staticEnv.Faces = [];
for i = 1:numel(staticMeshes)
    H = staticMeshes(i).Pose;
    V = staticMeshes(i).Vertices*H(1:3,1:3)'+ H(1:3,end)';
    nVert = size(staticEnv.Vertices,1);
    staticEnv.Vertices = [staticEnv.Vertices; V];
    staticEnv.Faces = [staticEnv.Faces; staticMeshes(i).Faces+nVert];
end
staticEnv.ID = 1;
Add the static environment mesh to the TSDF manager.
addMesh(tsdfs,staticEnv);
Convert the sphere collision geometry into a structure for the mesh TSDF manager. Assign it an ID of 2 and add it to the mesh TSDF manager.
obstacleID = 2;
dynamicObstacle = geom2struct(sph,obstacleID);
addMesh(tsdfs,dynamicObstacle);
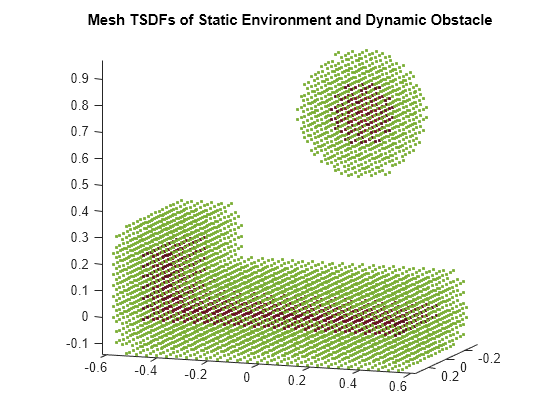
show(tsdfs)
view(v)
axis equal
title("Mesh TSDFs of Static Environment and Dynamic Obstacle")

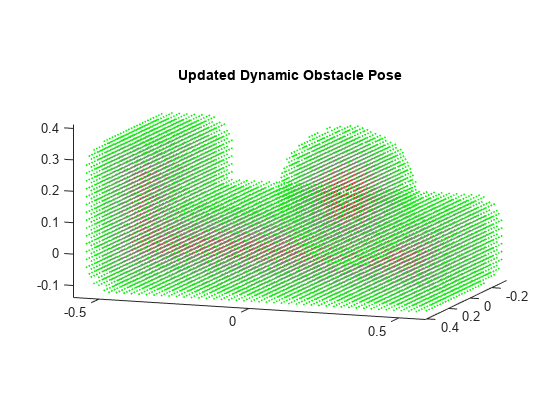
Update the pose of the dynamic obstacle in the mesh TSDF manager by changing Pose property of the object handle of the obstacle. Then use the updatePose function to update the pose of the mesh in the TSDF manager.
dynamicObstacle.Pose = trvec2tform([0.2 0.25 0.2]);
updatePose(tsdfs,dynamicObstacle)
ans =
1
show(tsdfs)
view(v)
axis equal
title("Updated Dynamic Obstacle Pose")

Input Arguments
Truncated signed distance field for 3-D meshes, specified as a meshtsdf
object.
Example: meshtsdf(meshes,TruncationDistance=5) creates a TSDF for the
specified meshes with a truncation distance of 5
meters.
Name-Value Arguments
Specify optional pairs of arguments as
Name1=Value1,...,NameN=ValueN, where Name is
the argument name and Value is the corresponding value.
Name-value arguments must appear after other arguments, but the order of the
pairs does not matter.
Example: show(tsdf,MeshID=[2 3]) plots the active voxels for meshes in
the TSDF with IDs 2 and 3.
Parent axes, specified as an Axes object in which to plot the
active voxels of mTSDF. By default the function plots the active
voxels in the active axes. For more information, see Axes Properties.
ID of mesh in TSDF to visualize, specified as a nonnegative integer or N-element vector of nonnegative integers. N is the total number of meshes to show.
Example: show(tsdf,MeshID=2) plots active voxels from the mesh
in the TSDF with the ID 2.
Example: show(tsdf,MeshID=[1 2 3]) plots active voxels from
meshes in the TSDF with the IDs 1, 2, and
3.
Range of distance values to plot, specified as a two-element vector in the form [MinDistVal MaxDistVal]. An active voxel must have a distance value in the range [MinDistVal, MaxDistVal] to be plotted. MaxDistVal must be a greater value than MinDistVal.
Example: show(tsdf,IsoRange=[-2 2]) plots active voxels
containing distance values between -2 and 2 from
all meshes in the TSDF.
Colorbar for the voxel distance values, specified as either
"off" or "on". For more information about
colorbars, see ColorBar Properties.
Example: show(sdm,Colorbar="on")
Fast updates to existing map plot, specified as a logical 0
(false) or 1 (true). If you
previously plotted your map on your figure, set to 1 for a faster
update to the figure. This is useful for updating the figure in a loop for fast
animations.
Output Arguments
Scatter plot of active voxels, returned as a Scatter object. For
more information, see Scatter Properties.
Version History
Introduced in R2024a
See Also
MATLAB Command
You clicked a link that corresponds to this MATLAB command:
Run the command by entering it in the MATLAB Command Window. Web browsers do not support MATLAB commands.
选择网站
选择网站以获取翻译的可用内容,以及查看当地活动和优惠。根据您的位置,我们建议您选择:。
您也可以从以下列表中选择网站:
如何获得最佳网站性能
选择中国网站(中文或英文)以获得最佳网站性能。其他 MathWorks 国家/地区网站并未针对您所在位置的访问进行优化。
美洲
- América Latina (Español)
- Canada (English)
- United States (English)
欧洲
- Belgium (English)
- Denmark (English)
- Deutschland (Deutsch)
- España (Español)
- Finland (English)
- France (Français)
- Ireland (English)
- Italia (Italiano)
- Luxembourg (English)
- Netherlands (English)
- Norway (English)
- Österreich (Deutsch)
- Portugal (English)
- Sweden (English)
- Switzerland
- United Kingdom (English)