使用 optimplot 监控求解过程
此示例显示如何使用 optimplot 绘图函数来监控解过程的几个方面。
注意:目前,optimplot 仅适用于 fmincon 求解器。
问题定义和第一个解
问题是最小化两个变量的目标函数
在区间 , , 内。使用优化变量来表达这个问题。
x = optimvar("x",LowerBound=-5);
y = optimvar("y",LowerBound=-5);
prob = optimproblem;
prob.Objective = (x+y)*exp(-y);
prob.Constraints = (y + x^2)^2 + 0.1*y^2 <= 1;
设置 的初始点。
x0.x = 1;
x0.y = -3/2;
solve 调用哪个求解器?
defaultSolver = solvers(prob)
defaultSolver =
"fmincon"
设置 fmincon 选项以使用 optimplot 绘图函数并解决问题。
opts = optimoptions("fmincon",PlotFcn="optimplot");
[sol,fval,eflag,output] = solve(prob,x0,Options=opts);
Solving problem using fmincon.
Local minimum found that satisfies the constraints.

Optimization completed because the objective function is non-decreasing in
feasible directions, to within the value of the optimality tolerance,
and constraints are satisfied to within the value of the constraint tolerance.

<stopping criteria details>
绘图详细信息
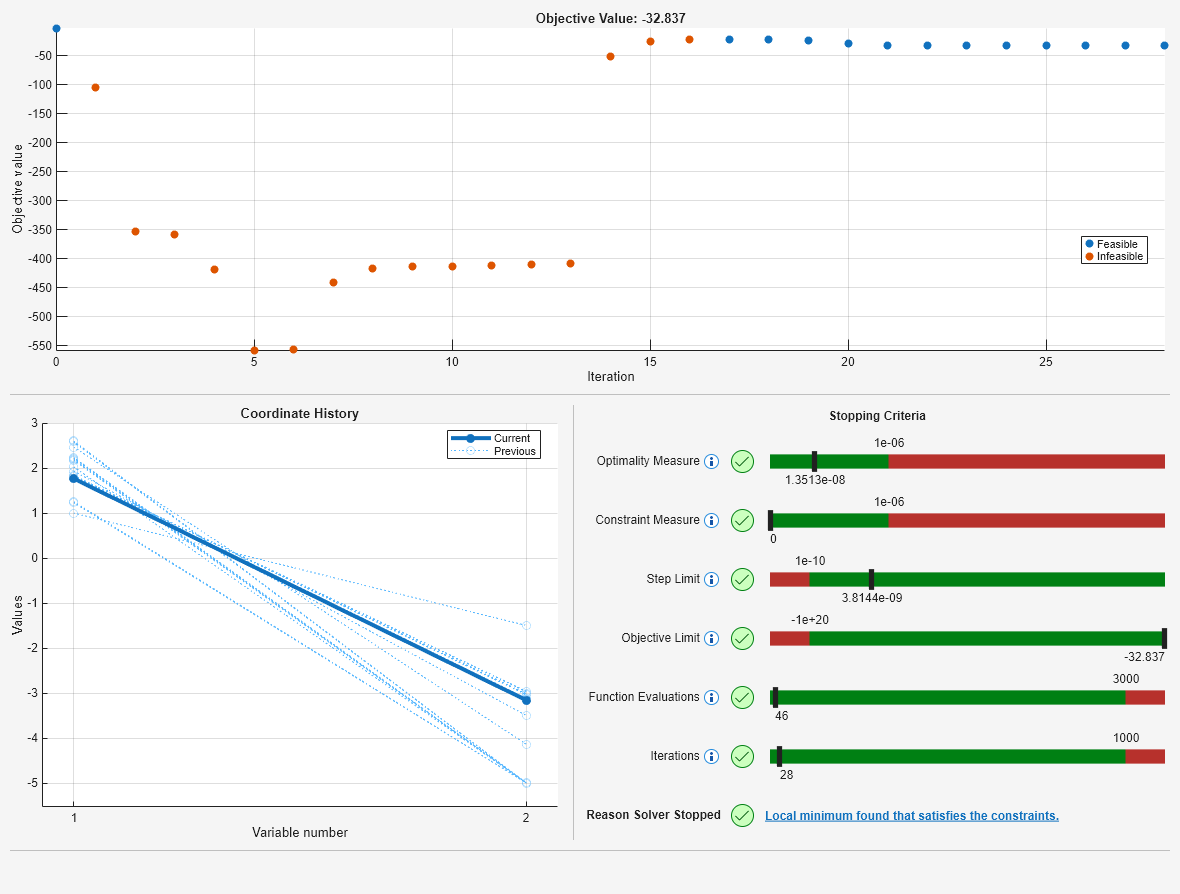
从顶部部分开始,检查图的每个部分。
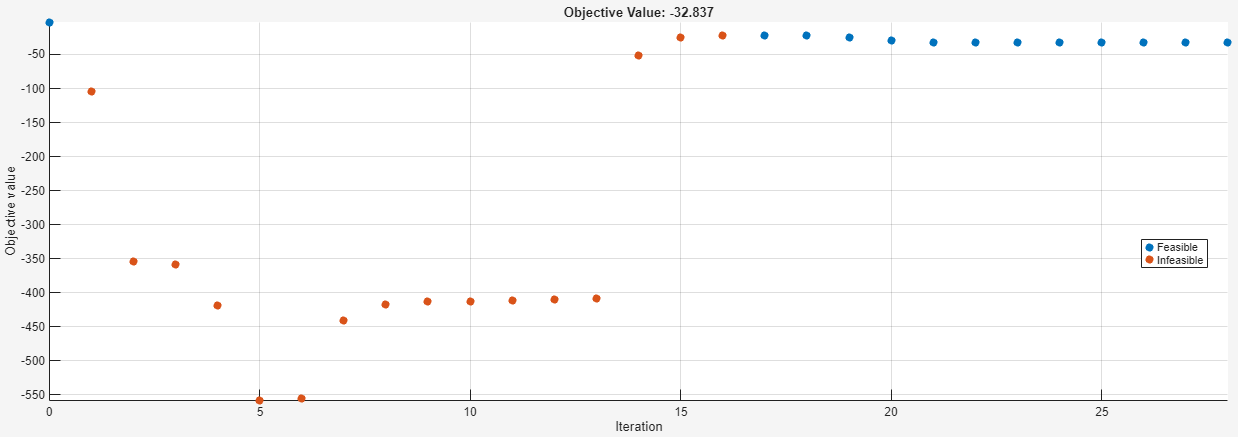
该图显示初始点(在左上角)是可行的,因为它被绘制为蓝点。“可行”表示该点满足所有约束,“不可行”表示该点不满足至少一个约束。接下来的几个点是红点,表示它们是不可行的。图的右侧部分包含所有蓝点,表示可行的迭代。
接下来,检查变量图,即左下部分。
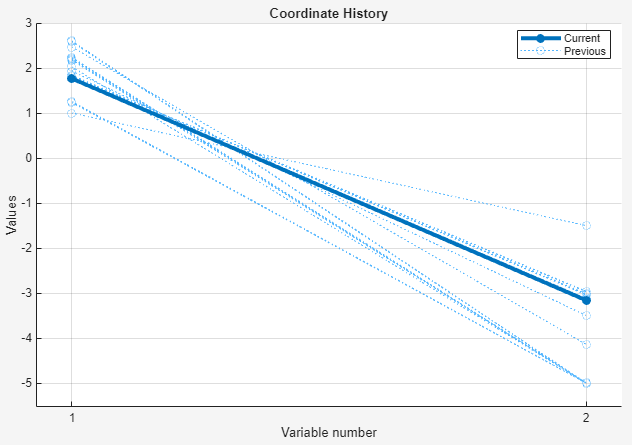
最后一个点被绘制成一条粗线。中间迭代绘制为较暗的虚线。
最后,检查右下部分,其中包含停止标准。
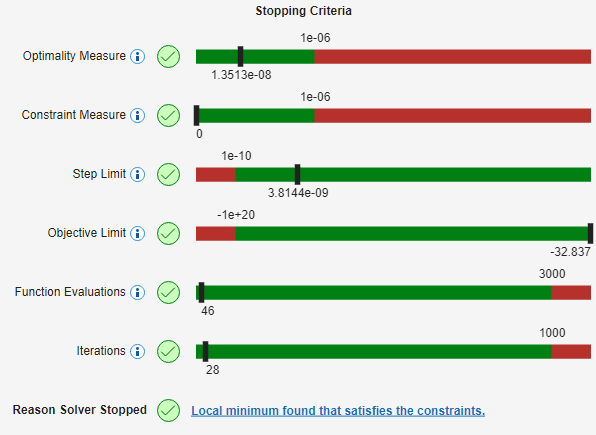
本节提供以下信息:
最优性度量 - 此栏显示一阶最优性度量得到满足。标记位于绿色区域,且值小于
OptimalityTolerance值 1e–6。此容差使求解器停止运行。约束测量 - 此栏显示所有约束均在
ConstraintTolerance的值(1e-6)范围内满足。该容忍度并不是实际的停止标准。相反,当约束不满足时,求解器会尝试继续。步长限制 - 此栏显示解算器未因
StepTolerance容差而停止。目标限制 - 此栏显示解算器未因
ObjectiveLimit容差而停止。函数评估 - 此栏显示求解器未因
MaxFunctionEvaluations容差而停止。迭代 - 此栏显示求解器未因
MaxIterations容差而停止。
请注意,求解器可以使用停止标准的相对值或缩放值。有关详细信息,请参阅容差详细信息。
三段剧情是同步的。当您点击顶部部分中的某个点时,所有三个部分都会显示与该点相关的值。点击第五个迭代点。
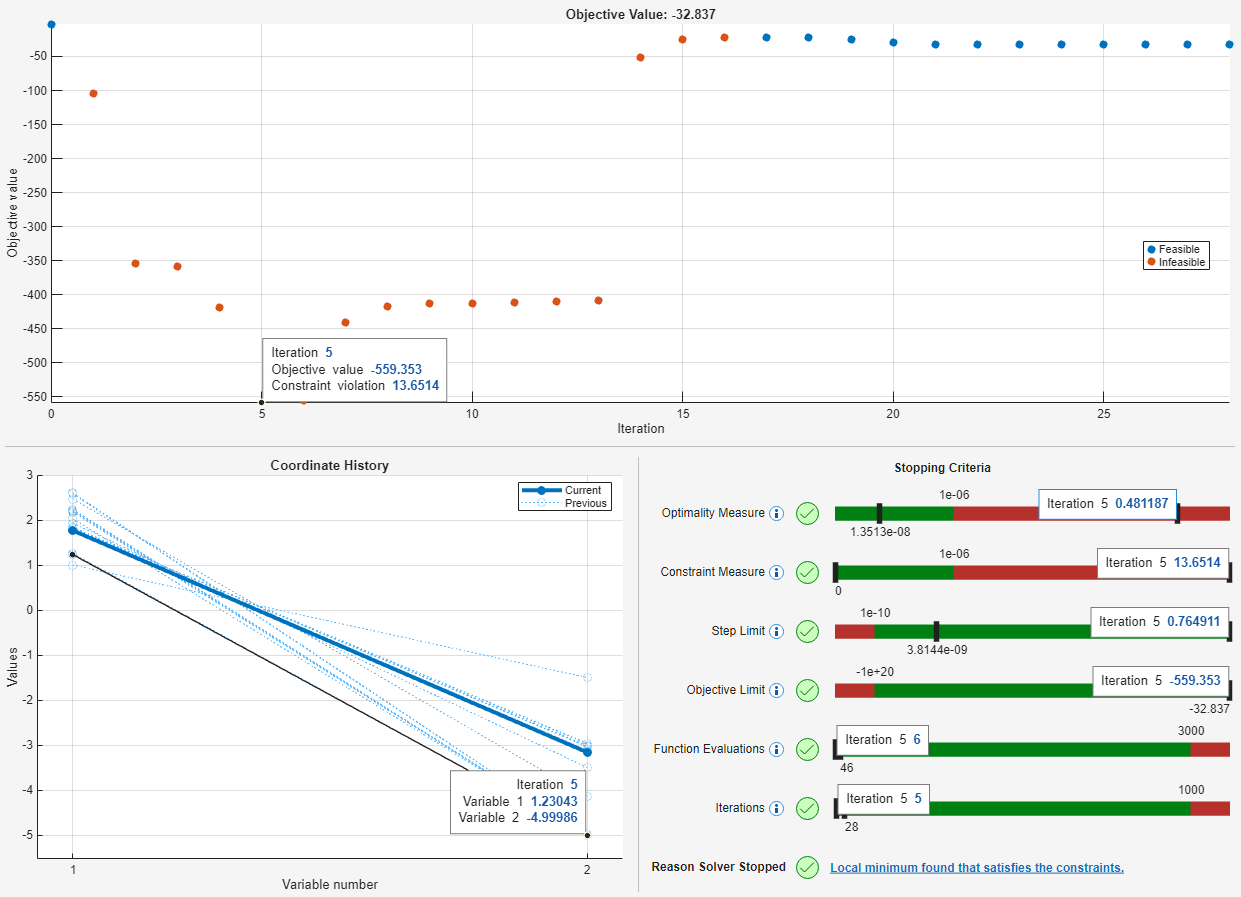
第五个迭代点具有最低的目标函数值。但这一点是行不通的。如上图所示,该点以红色绘制,且约束违反超过 13。停止标准部分中的约束度量栏显示违规的相同值,这也表明该点是不可行的。要删除第五次迭代的显示值,请再次点击该点。
动态绘图范围
您可能已经注意到,在求解器运行的早期迭代过程中,初始点是不可见的。下面是绘图函数的特写,在第七次迭代后暂停。
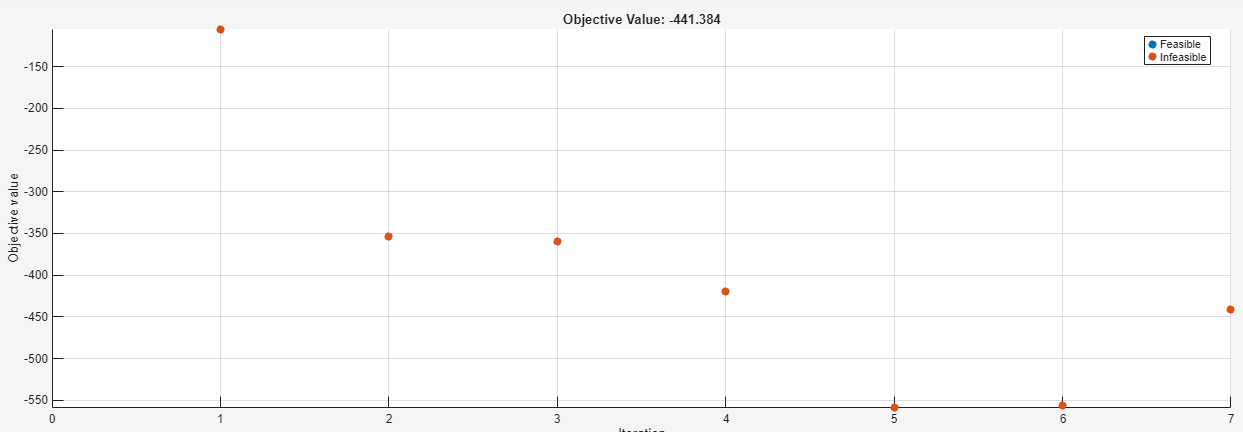
未绘制迭代 0 的点,因为它超出了绘图范围。optimplot 绘图函数尝试在迭代进行时显示相关范围,以便您更轻松地观察收敛。
寻找更好的解
停止标准部分的底部显示了求解器停止的原因,并提供了更多信息的链接。
![]()
点击链接,您将获得以下信息和链接。
![]()
点击“当求解器成功时”链接。在生成的文档页面中,第一个建议是改变初始点。因此,通过改变起点来寻找更好的解。
x0.x = -1;
x0.y = -1;
[sol2,fval2,eflag2,output2] = solve(prob,x0,Options=opts);
Solving problem using fmincon.
Local minimum found that satisfies the constraints.

Optimization completed because the objective function is non-decreasing in
feasible directions, to within the value of the optimality tolerance,
and constraints are satisfied to within the value of the constraint tolerance.

<stopping criteria details>
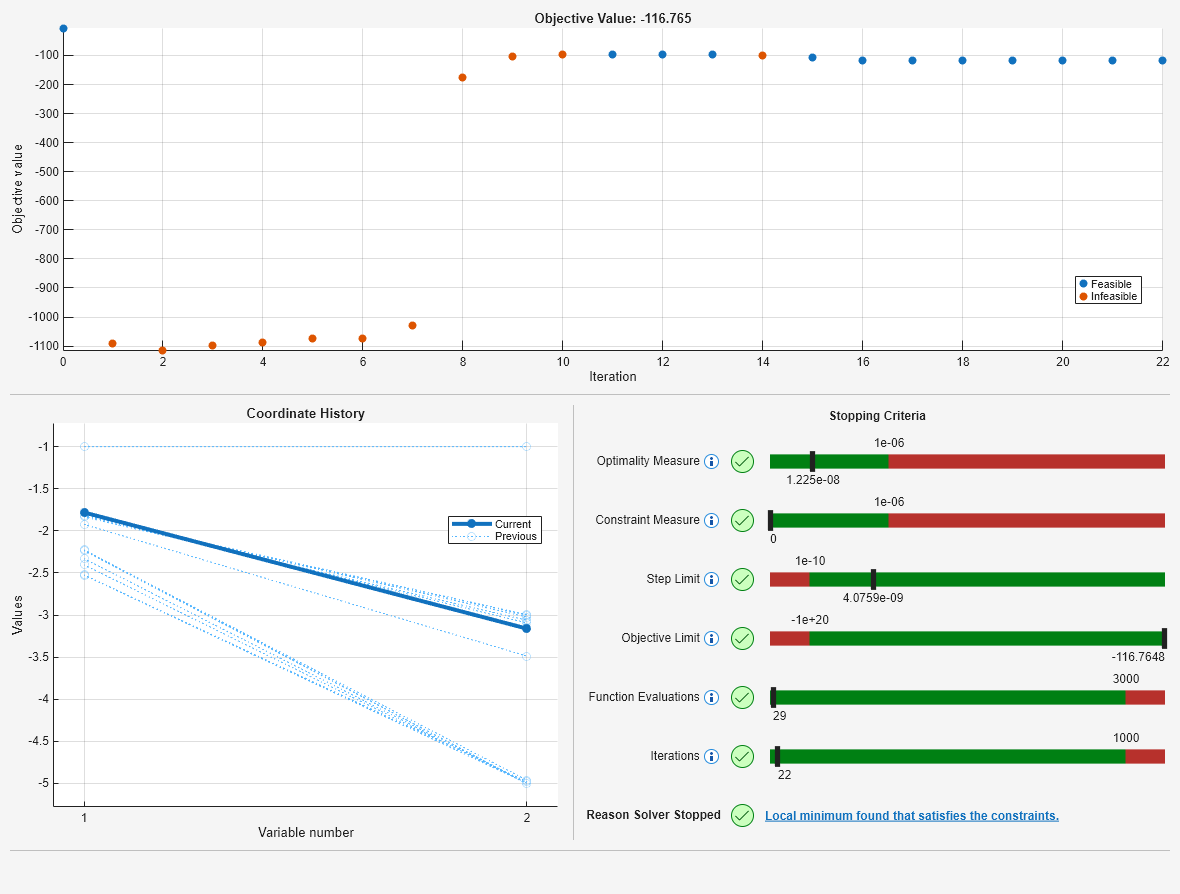
这次,该图显示 fmincon 达到了目标函数值 ,这比第一个解的值 更好(更低)。
结论
optimplot 绘图函数显示与求解器迭代相关的许多统计数据。在一个图中,您可以查看迭代点的可行性、用于停止迭代的各种措施以及迭代点的坐标,其中后面的点以粗体绘制。但是,optimplot 绘图函数不能保证显示的解是全局解。本例中第一个解是局部解,但不是全局解。正确解释结果仍然需要良好的判断力。