使用并行池仪表板监控池工作单元
池监控数据可帮助您了解池工作单元如何在并行池上执行并行构造,例如 parfor、parfeval 和 spmd。并行池仪表板收集监控数据,包括工作单元如何执行并行代码以及相关的数据传输信息。这些信息可帮助您识别瓶颈、平衡工作负载、确保资源利用效率,并优化并行代码的性能。
您可以使用并行池仪表板以交互方式收集池活动监控数据,或使用 ActivityMonitor 对象以编程方式收集数据,并在并行池仪表板中查看数据。对于大多数使用场景,请使用并行池仪表板进行交互式收集和查看监控数据。但是,如果您需要收集监控数据以供日后审查或用于在并行批处理池上运行的代码,请使用 ActivityMonitor 对象。有关详细信息,请参阅以编程方式收集池监控数据。
要打开“并行池仪表板”,请选择以下选项之一:
MATLAB® 工具条:在主页选项卡中的环境部分,选择并行 > 打开并行池仪表板。
并行状态指示灯:点击指示图标,选择打开并行池仪表板。
MATLAB 命令提示符:输入
parpoolDashboard。
并行池仪表板在以下各部分显示监控数据。
| 部分 | 详细信息 |
|---|---|
并行构造 | 显示有关工作单元执行的并行构造类型、调用并行构造的父函数或脚本以及并行构造运行的函数的详细信息(如果可用)。 |
时间线 | 以可视化方式显示工作单元和客户端运行并行构造和传输数据所花费的时间。例如,深蓝色表示运行 时间轴图表最多只能显示 32 个工作单元的池监控数据。 |
摘要 | 总结整个监控会话,包括监控的开始和停止时间、总繁忙时间、客户端发送给工作单元的数据字节数,以及并行效率(即工作单元繁忙时间占监控时间的百分比)。 |
工作单元摘要 | 汇总来自时间轴图的信息,提供每个工作单元的活动概述。 |
调用堆栈 | 扩展了有关调用并行构造的父函数或脚本以及并行构造运行的函数的信息。只有选择特定的并行构造时,调用堆栈才可见。 |
使用这些示例来探索并行池仪表板的特性。
比较并行代码的性能
此示例演示了如何使用并行池仪表板比较 parfor 循环的性能。
当您在 parfor 循环之前初始化一个变量并在循环中使用它时,必须将其传递给每个评估循环迭代的 MATLAB® 工作单元。parfor 函数只将循环使用的变量从客户端工作区传输到工作单元。但是,如果循环变量索引了该变量的所有出现位置,则 parfor 会将该变量分段,并只将每个工作单元所需的部分发送给该工作单元。使用分段变量可减少客户端与工作单元之间的数据传输开销。
通过使用并行池仪表板收集监控数据,比较带分段变量的和不带分段变量的 parfor 循环。
打开并行池仪表板。在“并行池仪表板”的监控部分,点击开始监控。当并行池仪表板开始收集监控数据时,返回实时编辑器,然后点击运行部分。

在此代码中,parfor 将 data 变量分解为多个片段,然后由不同的工作单元分别对这些片段进行操作。
A = 500;
M = 100;
N = 1e6;
data = randn(M,N);
parfor idx = 1:M
    a = max(abs(eig(rand(A))));
    b = sum(data(idx, :))./N;
    r(idx) = a*b;
end
pause(1)
现在,假设您在 data 循环中不小心使用了对 N 变量的引用,而不是 parfor。问题在于,对 size(data,2) 的调用将分段变量 data 转换为广播(非分段)变量。
parfor idx = 1:M
    a = max(abs(eig(rand(A))));
    b = sum(data(idx,:))./size(data,2);
    r(idx) = a*b;
end

disp("Section complete!")
Section complete!
在完成段落代码后,在监控部分,选择停止。并行池仪表板显示监控结果。
并行池仪表板显示 parfor 循环的两组信息,两组之间以一秒的间隔分隔。
在并行构造表中,选择第一个 parfor 计算,即带有分段变量 parfor 的 data 循环。时间轴图和摘要及工作单元摘要表现在显示所选 parfor 循环的特定信息。时间轴(Timeline)图形中与所选构造无关的元素以灰色显示。现在,调用堆栈表在摘要表下方显示。要展开调用堆栈表,请点击右箭头。调用堆栈表在语句列中显示 parfor 循环。
时间轴图显示,每个工作单元执行 parfor 迭代所需的时间大致相同,且工作单元不会长时间处于空闲状态。数据传输时间也非常短。在摘要表中,请注意 parfor 循环执行时间为 3.291 秒,客户端发送给工作单元的数据总计为 763.02 MB。
在并行构造表中,选择第二个 parfor 构造,即带有意外广播变量 parfor 的 data 循环。时间轴图显示工作单元在最初的一到两秒钟内接收来自客户端的数据。在摘要表中,parfor 循环的执行时间为 5.734 秒,客户端向工作单元发送了总计 763.02 MB 的数据。由于传输到工作单元的数据量较大,因此包含意外广播变量的 parfor 循环的执行时间更长。
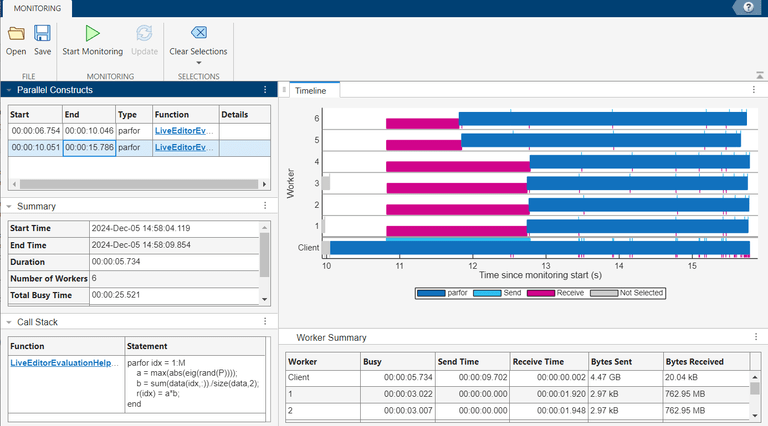
由于结果是一个常量,您可以通过在循环外部计算 data 变量来避免其被分段。通常,应在循环开始前执行仅依赖于广播数据的计算,因为广播数据在循环内部无法被修改。在这种情况下,计算非常简单,结果是一个标量,因此将计算移出循环可以带来好处。
在监控数据中识别 parfeval 计算
此示例演示了如何在并行池仪表板显示的监控数据中识别 parfeval 计算的详细信息。
parfeval 函数在不阻止客户端的情况下,在工作单元上异步执行函数。工作单元随时执行该函数,因此很难确定执行何时完成。当您收集用于 parfeval 计算的池监控数据时,并行池仪表板会以一种便于您在类似计算中识别特定 parfeval 计算详细信息的方式显示这些数据。
启动三个工作单元的池。
pool = parpool(3);
Starting parallel pool (parpool) using the 'Processes' profile ...
Connected to parallel pool with 3 workers.
收集一组 parfeval 计算的池监控数据,每个计算运行不同的函数。
打开并行池仪表板。在并行池仪表板的监控部分,选择开始监控。当并行池仪表板开始收集监控数据时,返回实时编辑器并选择运行部分。

执行 dollarAuctionModels 辅助函数,该函数已作为支持文件附加到本示例中。dollarAuctionModels 函数使用 parfeval 函数以异步方式对指定次数的不同美元拍卖模型进行蒙特卡罗仿真。
numTrials = 1000;
auctionFutures = dollarAuctionModels(1000);
引入一个短暂停顿,以仿真调度 parfeval 计算之间的延迟。
pause(1)
使用蒙特卡罗方法执行一系列异步 parfeval 计算,为金融选项定价。这些模型的辅助函数也作为支持文件附在此示例中。
定义要运行的模型列表。
modelFunctions = {@mcAsianCallOption,@mcDownAndOutCallOption,@mcLookbackCallOption,@mcStockPrice,@mcUpAndOutCallOption};
numModels = length(modelFunctions);
加载模型输入参数。
load pricingParams.mat使用 parfeval 并行仿真每个模型。
optionFutures(1:numModels) = parallel.FevalFuture;
for m = 1:numModels
    optionFutures(m) = parfeval(modelFunctions{m},1,params);
end
使用 parfevalOnAll 对所有工作单元执行短暂停顿,以确保在停止收集池监控数据之前,所有 parfeval 计算都已完成。
syncF = parfevalOnAll(@pause,0,0.1);
wait(syncF)

disp("Section complete.")
Section complete.
在完成部分代码后,在并行池仪表板的监控部分,选择停止。并行池仪表板显示监控结果。
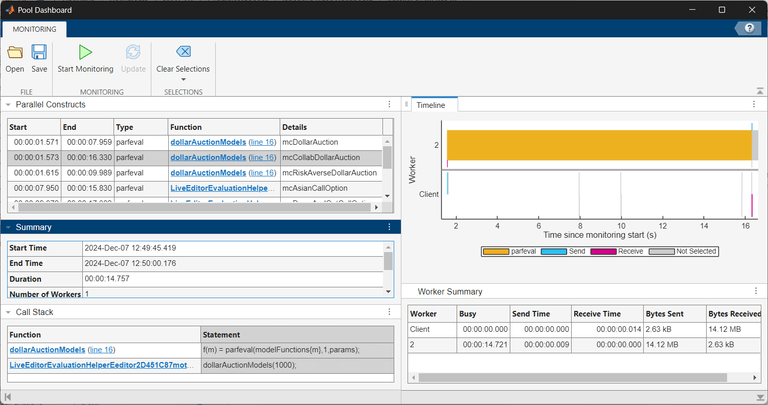
与监控 parfor 循环的结果不同,并行构造表在详细信息列中列出了每个 parfeval 计算所评估的函数名称。函数列列出了调度 parfeval 计算的父函数或脚本。例如,dollarAuctionModels 函数使用 parfeval 函数来评估 mcDollarAuction、mcCollabDollarAuction 和 mcRiskAverseDollarAuction 辅助函数。
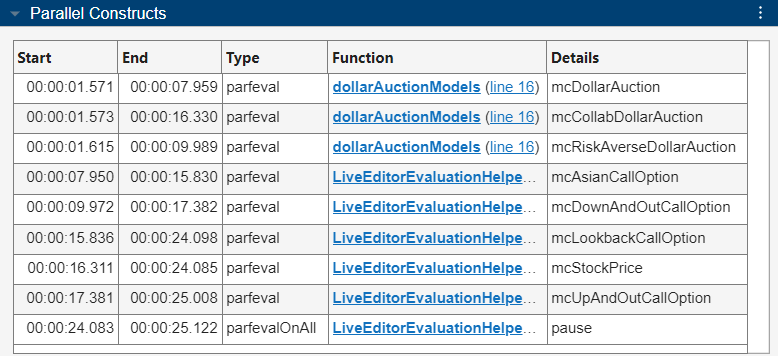
时间轴图表示工作单元运行 parfeval 计算所花费的时间为黄色,运行 parfevalOnAll 计算所花费的时间为紫色。相同的 parfevalOnAll 计算在所有工作单元上以不同的时间发生。您可以看到,每个工作单元在没有空闲时间的情况下完成了多个 parfeval 计算。蓝色和品红色的数据传输条有助于区分不同的 parfeval 条。工作单元 2 上的第一个 parfeval 条比其他条更长。要识别导致长时间运行的 parfeval 计算的代码,请选择该代码块。
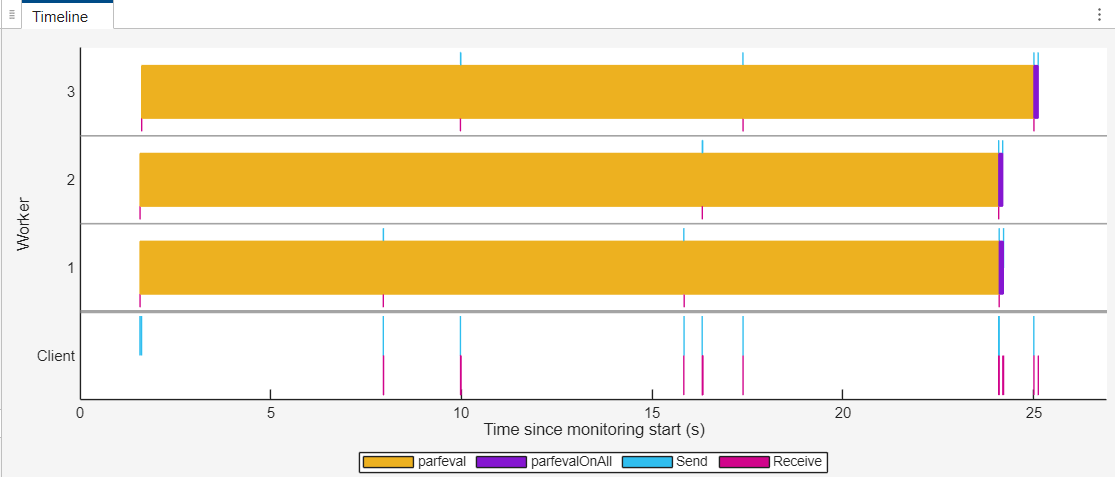
时间轴图和摘要以及工作单元摘要表现在显示所选 parfeval 计算的特定信息,而并行构造表则突出显示所选 parfeval 条形图的行。所选 parfeval 计算的调用堆栈表现在摘要表下方显示。要展开调用堆栈表,请点击右箭头。调用栈 堆栈表显示了 parfeval 函数调用在语句列中的信息。此信息表明,Live Editor 脚本调用 dollarAuctionModels 函数,该函数又调度了长时间运行的 parfeval 计算。parfeval 运算评估 mcCollabDollarAuction 函数。
要清除当前选定的 parfeval 计算的信息并再次查看所有工作单元的活动数据,请在“并行池仪表板”的选择部分中点击清除选择。
分析分布式数组计算
此示例展示了如何分析在使用分布式数组进行计算时收集的池监控数据。
分布式数组是一个单一变量,在并行池中的多个工作单元之间进行划分。当您将函数应用于分布式数组时,MATLAB® 使用 spmd 语句在池中的所有工作单元上同时执行这些函数。并行池仪表板收集每个 spmd 计算的监控数据。
在此示例中,您在集群工作单元的并行池上使用分布式数组求解线性方程组,同时收集和分析池监控数据。
使用远程集群配置文件 MyCluster 启动集群工作单元的并行池。
pool = parpool("MyCluster",12);Starting parallel pool (parpool) using the 'MyCluster' profile ... Connected to parallel pool with 12 workers.
打开并行池仪表板。在“并行池仪表板”的监控部分,点击开始监控。当并行池仪表板开始收集监控数据时,返回实时编辑器,然后点击运行部分。

定义一个适合池中工作单元数量的足够大的数组大小。
nWorkers = pool.NumWorkers;
n = floor(sqrt(4096*4096*nWorkers));
要直接在工作单元上构建分布式数组,请使用函数 "distributed" 和 randi 的参量 ones。定义系数矩阵 A 及用于对比的精确解 xEx。
A = randi(100,n,n,"distributed");
xEx = ones(n,1,"distributed");
定义右向量 b 为 A 的行和。向量 b 也是分布的。
b = sum(A,2);
使用 mldivide 直接求解该系统。
x = A\b;
计算所得结果 x 的每个元素与 xEx 的预期值之间的平均误差。
err = abs(xEx-x);
mErr = mean(err);

disp("Section complete.")
Section complete.
在完成部分代码后,在并行池仪表板的监控部分,选择停止。并行池仪表板显示监控结果。
并行构造表和时间轴图将分布式数组上的计算显示为 spmd 计算。在并行构造表和时间轴图中,spmd 计算的计数与 MathWorks® 实用工具函数调用 spmd 在分布式数组上执行代码的频率相对应。
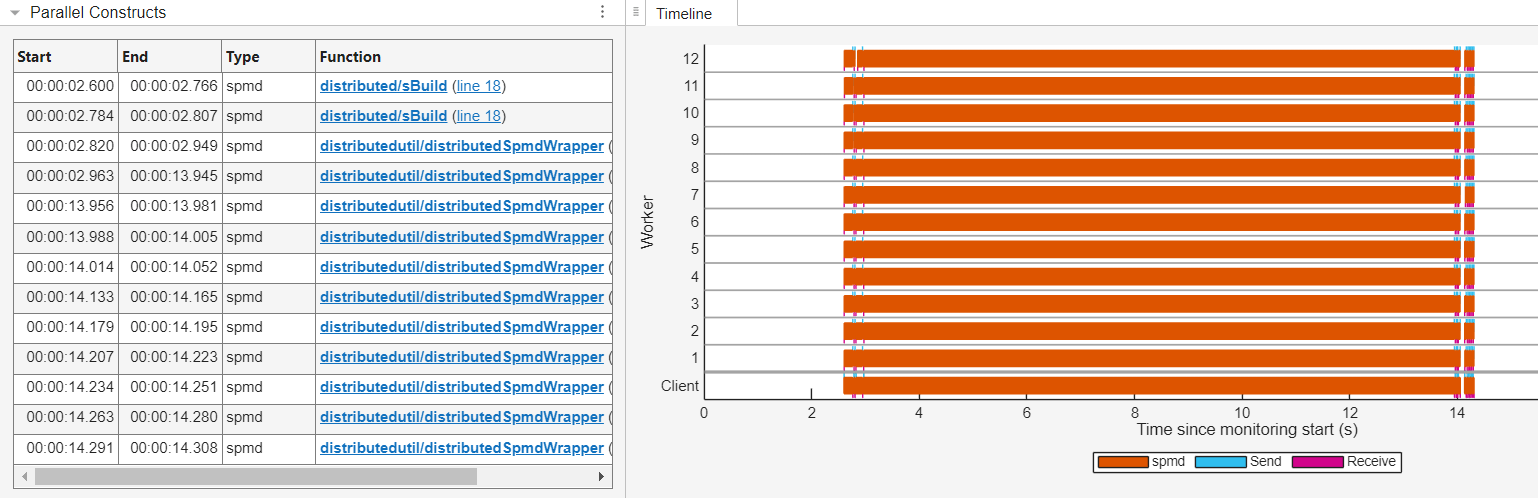
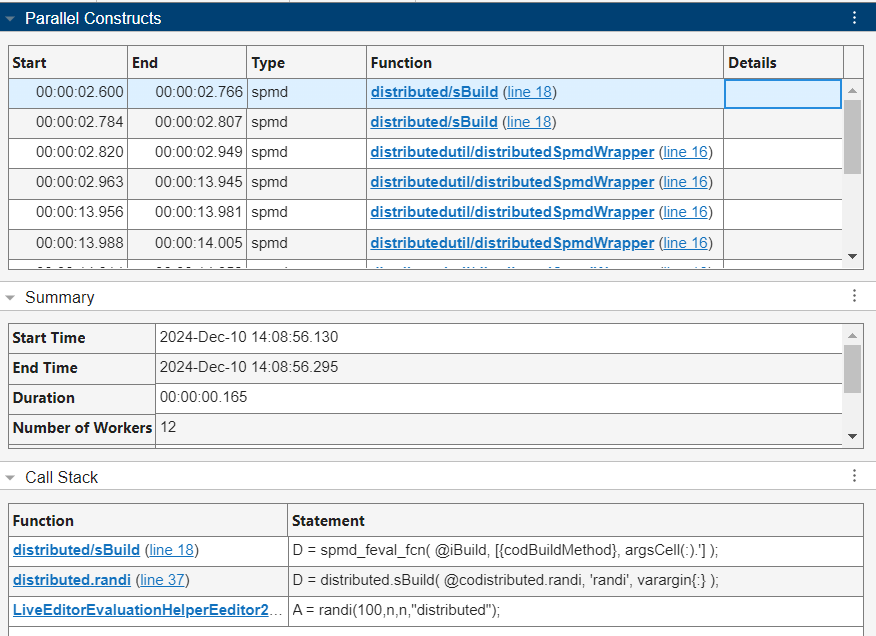
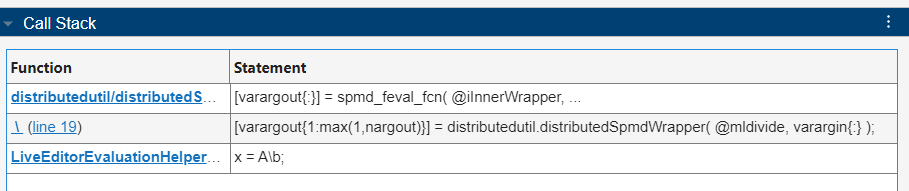
并行构造表列出了在函数列中调用 spmd 的实用工具函数。您可以在调用堆栈表中识别出负责任何 spmd 计算的代码行。例如,要查看实用工具函数 spmd 启动的 distributed/sBuild 计算的调用堆栈表,请选择并行构造表中的第一行。所选 spmd 计算的调用堆栈表现在摘要表下方显示。要展开调用堆栈表,请点击右箭头。
调用堆栈表以分层顺序详细显示了负责 spmd 计算的代码信息,其中父函数或脚本以及具体代码行出现在最底行。调用堆栈表中的信息表明,实用工具函数 distributed/sBuild 在工作单元上创建了分布式数组 A。
要清除当前选定的 spmd 计算的信息并再次查看所有 spmd 计算的监控数据,请在“并行池仪表板”的选择部分中点击清除选择。
时间轴图以橙色条形图的形式直观地显示了每个工作单元上 spmd 计算的持续时间。蓝色和品红色的数据发送和接收条有助于区分各种 spmd 条。在任何工作单元中寻找最长的橙色条,它表示运行时间最长的 spmd 计算。选择条形图。
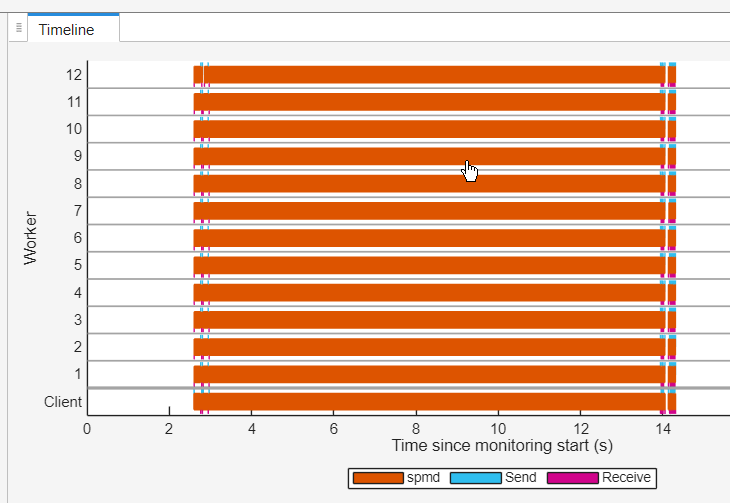
时间轴图、摘要和工作单元摘要表现在显示所选 spmd 计算的特定信息,而并行构造表则突出显示所选 spmd 条形图的行。所选的 spmd 计算的调用堆栈表也显示出来。调用堆栈信息表明,运行时间最长的 spmd 语句正在评估 mldivide 函数。
测量和提高并行效率
此示例展示了如何使用并行池仪表板来测量和提高并行池上的计算并行效率。
并行池仪表板并行效率度量可帮助您识别并行池工作流中的低效率问题。并行池仪表板使用以下公式计算并行效率:
,
其中
总繁忙时间是所有工作单元积极处理任务的累计时间。
持续时间是指从监控期开始到结束的总时间。
工作单元数是并行池中的工作单元总数。
在此示例中,您在执行工作流以使用交互式并行池导入和自动处理数据的同时,收集池监控数据。使用池监控数据(尤其是并行效率度量)来确定工作流是否有效地使用了池工作单元。
测量并行效率
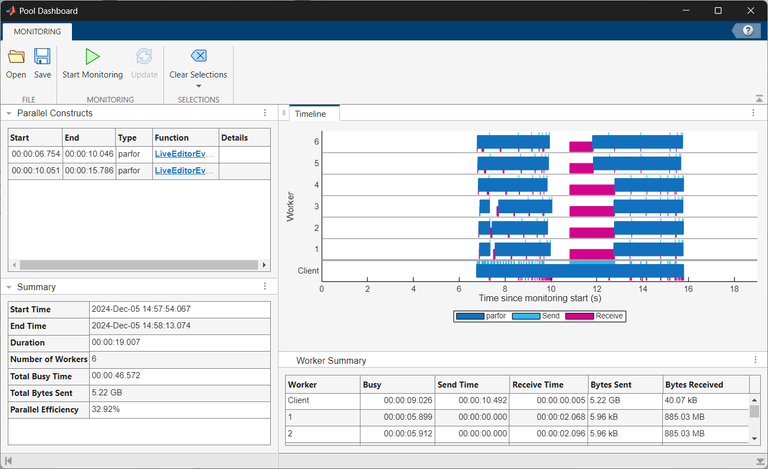
启动一个由六个工作单元组成的并行池。
parpool("Processes",6);Starting parallel pool (parpool) using the 'Processes' profile ... Connected to parallel pool with 6 workers.
打开并行池仪表板。在“并行池仪表板”的监控部分,点击开始监控。当并行池仪表板开始收集监控数据时,返回实时编辑器,然后点击运行部分。

获取并自动处理数据,并进行迭代处理。将 importDataFromDatabase 函数安排为与 parfeval 异步导入数据,然后在 processData 循环中使用 parfor 函数处理数据。importDataFromDatabase 和 processData 辅助函数在本示例的末尾定义。
numIter = 3;
w = 30;
for idx = 1:numIter
    future = parfeval(@importDataFromDatabase,1,w);
    data = fetchOutputs(future);
    parfor col = 1:w
        out(col) = processData(data(:,col));
    end
end

disp("Section complete.")
Section complete.
在完成部分代码后,在并行池仪表板的监控部分,选择停止。并行池仪表板显示监控结果。
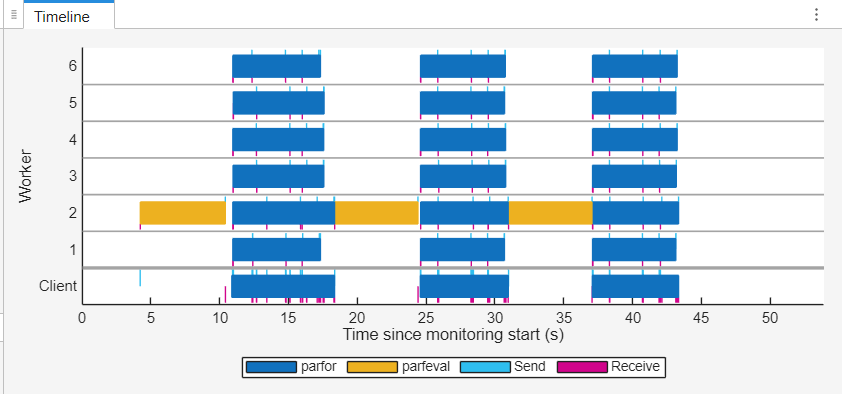
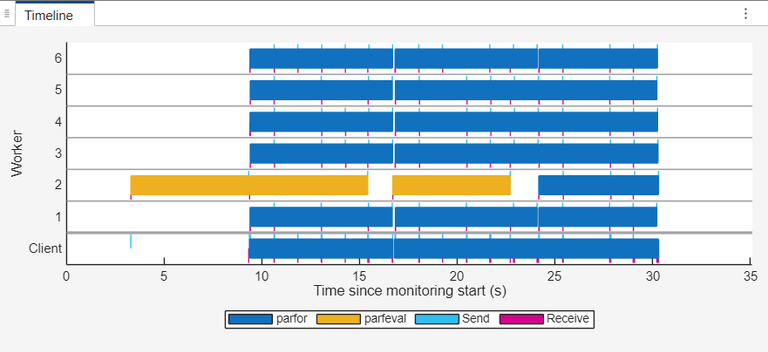
时间轴图显示,在大多数工作单元在 parfeval 执行期间处于空闲状态。此空闲时间源于代码结构,其中 parfor 循环无法在 parfeval 计算完成前开始。
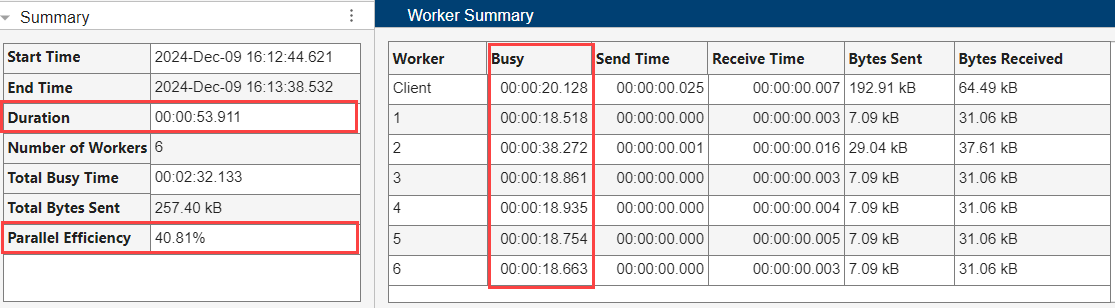
在工作单元摘要表中,工作单元的最大繁忙时间为 38.272 秒,总持续时间为 53.911 秒。工作流的并行效率为 40.81%,表明工作单元未得到有效利用。
池监控数据突出了并行处理代码中的低效率问题。该代码使用异步的 parfeval 计算来导入数据,然后等待计算完成后,再进入 parfor 循环 处理数据。这种方法会带来不必要的延迟,因为循环会依次等待 parfeval 计算,从而阻止软件充分利用并行工作单元。
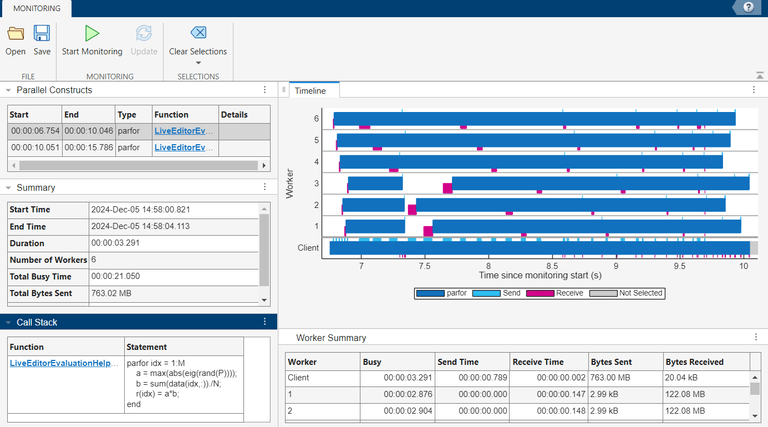
提高并行效率
为了提高并行效率,请重新结构代码,使数据导入和处理任务重叠,最大限度地减少工作单元的空闲时间。在开始 for 循环 之前,请先异步启动首次数据导入。这种重组使工作单元在等待数据导入完成的同时,能够继续执行其他任务。
运行重构后的代码,并通过并行池仪表板收集监控数据。在“并行池仪表板”的监控部分,点击开始监控。当并行池仪表板开始收集监控数据时,返回实时编辑器,然后点击运行部分。
future = parfeval(@importDataFromDatabase,1,w);

for idx = 1:numIter
    data = fetchOutputs(future);
    if idx < numIter
        future = parfeval(@importDataFromDatabase,1,w);
    end
    parfor col = 1:w
        out(col) = processData(data(:,col));
    end
end

disp("Section complete.")
Section complete.
在完成部分代码后,在并行池仪表板的监控部分,选择停止。并行池仪表板显示监控结果。
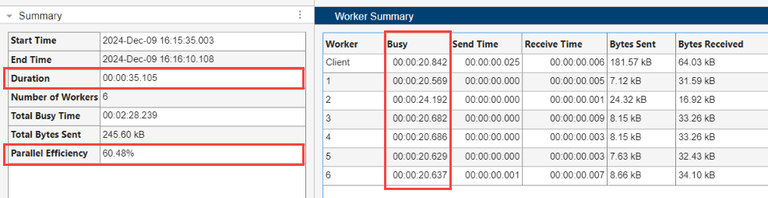
时间线图表显示了数据导入 parfeval 和数据处理 parfor 计算之间的重叠部分。parfeval 计算现在以异步方式进行,parfor 循环不再等待 parfeval 计算完成后才使用池中的剩余工作单元执行。
与低效的并行代码相比,工作单元摘要表仍然显示了类似的工作单元繁忙时间,但工作流持续时间缩短至 35 秒。时间缩短后,工作流的并行效率从 40.81% 提高到 60.48%。
辅助函数
importDataFromDatabase 函数仿真从数据库导入数据。该函数生成一个由输入 in 指定大小的魔方阵,并通过暂停 6 秒钟来仿真延迟。
function out = importDataFromDatabase(in)
out = magic(in);
pause(6)
end
processData 函数计算输入 data 中的元素之和,并暂停 1.2 秒以仿真非平凡计算。
function out = processData(data)
        out = sum(data);
        pause(1.2)
end
另请参阅
函数
parfor|parfeval|distributed|spmd