Optimize Parallel Pools for Multithreaded Computations
R2026bThis example shows how to improve the performance of your parallel computations by adjusting the number of threads per worker in a parallel pool.
MATLAB® uses implicit multithreading to allow certain numerical functions to use multiple cores, increasing computational efficiency. By default, the MATLAB client supports implicit multithreading. However, parallel pool workers use a single computational thread by default, as they typically associate with a single core. If the MATLAB functions in your code benefit from implicit multithreading, you can increase the number of computational threads on each worker to take advantage of the built-in parallelism.
In this example, you compare the speedup gained by performing computations on a parallel pool versus the MATLAB client. This comparison helps you identify the optimal worker-thread configuration for your parallel pool. You can follow these steps to find the optimal setup for your specific parallel application and hardware. The execution times in this example were obtained on a Windows 11, Intel® Xeon® W-2133 @ 3.60 GHz test system.
Set Execution Parameters
In this example, you measure the execution time of repeatedly performing matrix multiplications with the same input matrix.
First, determine the maximum number of computational threads MATLAB uses by default. Then, set the number of iterations proportional to this maximum. This example can take several minutes to complete. To reduce execution time, consider decreasing the number of iterations.
nT = maxNumCompThreads;
numIterations = nT*10;
Initialize the array to multiply.
N = randn(5000);
Use these variables in later steps to measure the execution time on different execution environments.
Compare Execution on Client and Parallel Pool
Measure the time the client takes to repeatedly calculate the product of N*N.
timer = tic;
for iteration = 1:numIterations
    outMulti = N*N;
end
tClient = toc(timer)
tClient =
46.1742
Start a parallel pool with a number of workers equal to the maximum computational threads available on your local machine.
pool = parpool("Processes",nT);Starting parallel pool (parpool) using the 'Processes' profile ... Connected to parallel pool with 6 workers.
Convert the for-loop to a parfor-loop and execute the parfor-loop across all the workers in your parallel pool. Measure the execution time.
timer = tic;
parfor iteration = 1:numIterations
    outPool = N*N;
end
tPool = toc(timer)
tPool =
52.5498
Calculate the speedup by computing the ratio between the execution time on the client and the execution time on the parallel pool. Divide the client execution time by itself to get a speedup ratio of 1 for comparison with pool execution time.
speedup = tClient./[tClient,tPool];
Compare the speedup ratios. The speedup ratio for the client is similar to that of the parallel pool with six workers. This result suggests one of the following:
The
parfor-loop has high parallel overhead.The
mtimesfunction already benefits from parallelization via multithreading on a client with multiple cores.A combination of high parallel overhead and existing multithreading benefits.
figure;
bar(speedup)
xticklabels(["Client","Pool"]);
xlabel("Execution Environment")
ylabel("Speedup Ratio")
grid on
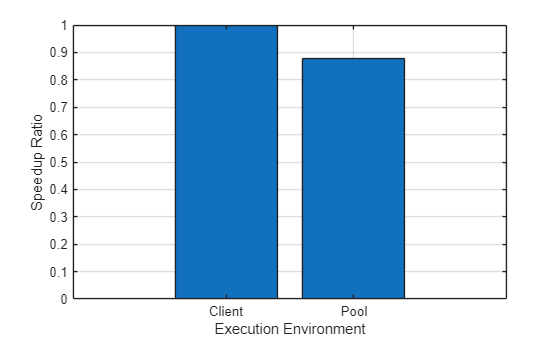
Because the speedup for the parallel pool is much lower than expected, the following sections examine whether additional performance improvements are possible by:
Calculating the scalability of the
parfor‑loop code to determine whether better performance is possible with fewer workers.Checking whether
mtimesalready uses parallelization through implicit multithreading.Increasing the number of computational threads per worker to improve performance.
Calculate Scalability
To determine the scalability of your parfor-loop, measure how the speedup changes with different numbers of workers. This helps you find out if your code benefits from additional parallel resources and identify any limits to scalability.
Create an array to store the result of each test.
tScale = zeros(1,nT);
Use a for-loop to iterate through different numbers of workers to run the parfor-loop. To specify the number of workers that execute the parfor-loop, use the second input argument of parfor.
for j = 1:nT
    timer = tic;
    parfor (iteration = 1:numIterations,j)
        outPool = N*N;
    end
    tScale(j) = toc(timer);
end
Calculate the speedup by computing the ratio between the execution time of a single worker and the execution time of the different numbers of workers.
speedupScale = tScale(1)./tScale;
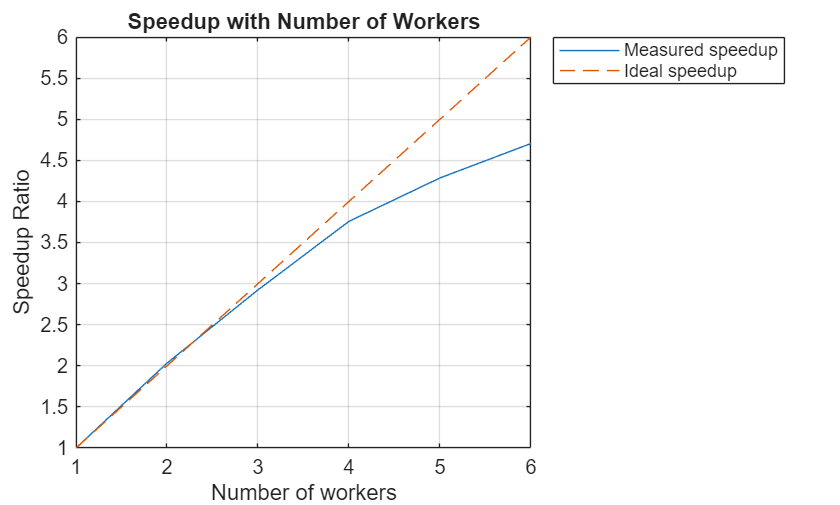
To visualize how the computations scale up with the number of workers, plot the speedup ratios against the number of workers. The speedup ratios increase linearly with the number of workers, but then start to increase nonlinearly after four workers. Adding more than four workers yields diminishing returns due to overhead from task coordination and data transfer.
figure;
plot(1:nT,speedupScale);
hold on
plot(1:nT,1:nT,"--");
hold off
title("Speedup with Number of Workers");
xlabel("Number of workers");
xticks(1:nT);
ylabel("Speedup Ratio");
legend("Measured speedup","Ideal speedup",Location="bestoutside")
grid on
If your code benefits from implicit multithreading, then you can further improve the performance of the parallel pool by increasing the number of threads per working. First, test if your code benefits from multithreading.
Check Code for Multithreading
MATLAB supports implicit multithreaded computation for various linear algebra and numerical functions, allowing them to run on multiple cores if certain conditions are met. For more information on multithreading, see Run MATLAB on multicore and multiprocessor machines.
To determine if your code benefits from implicit multithreading, compare execution times on a client with a single thread, a client with multiple threads (multithreaded), and a parallel pool.
To obtain the single-threaded execution time, use the maxNumCompThreads function to limit the MATLAB client to a single thread.
maxNumCompThreads(1);
timer = tic;
for iteration = 1:numIterations
    outSingle = N*N;
end
tSingle = toc(timer)
tSingle =
214.7032
Calculate the speedup by computing the ratio between the execution time on the single-threaded client and the previously measured execution time on the multithreaded client and the parallel pool. Divide the single-threaded client execution time by itself to get a speedup ratio of 1 for comparison with the other execution times.
speedupMulti = tSingle./[tSingle,tClient,tPool];
Compare the speedup ratios across different execution environments.
figure;
bar(speedupMulti)
xlabel("Execution Environment")
xticklabels(["Single-threaded","Multithreaded","Pool"])
ylabel("Speedup Ratio")
grid on
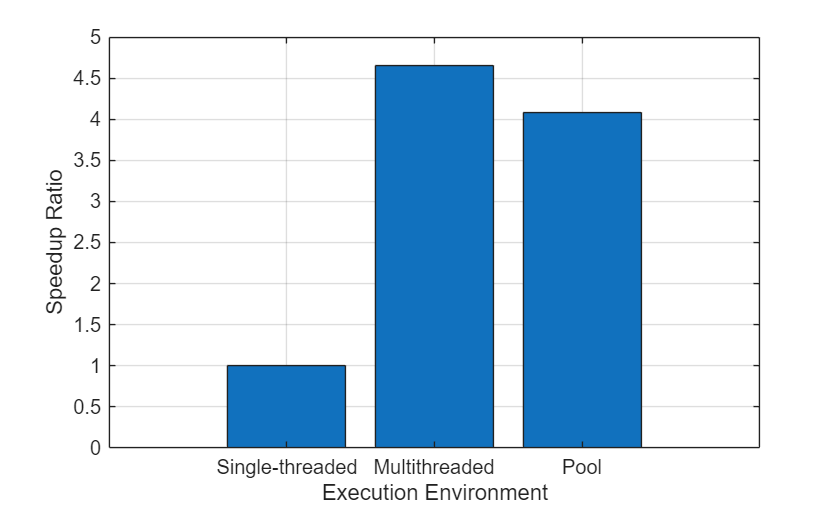
The matrix multiplication computations perform better with implicit multithreading on the client, and the multithreaded speedup is comparable to that of the parallel pool. To further improve performance, you can use the implicit multithreading capability of the mtimes function on the pool workers.
Reset the client to use the default maximum number of threads.
maxNumCompThreads("automatic");Test Multiple Threads on Pool Workers
Change the number of computational threads to use on each worker so that your workers can run in multithreaded mode and use the built-in parallelism of functions like mtimes. You can experiment to find the optimal combination of workers and threads for your specific problem and hardware.
Identify the maximum number of computational threads available on your machine again. Currently, the maximum number of computational threads is equal to the number of physical cores on your machine.
nT = maxNumCompThreads;
The number of threads across all the workers in the pool must not exceed the maximum number of computational threads on your machine. Make sure that NumWorkers x NumThreads ≤ maximum number of computational threads. Otherwise, you might have reduced performance.
Use the findFactors helper function, defined at the end of the example, to identify all possible divisors of the maximum number of computational threads. These divisors represent potential numbers of workers. Calculate the number of threads for each worker by dividing the total threads by the number of workers.
numWorkers = findFactors(nT);
numThreads = nT./numWorkers;
Prepare an array to store execution times for the different combinations of workers and threads.
tThreads = zeros(size(numWorkers));
For each combination of workers and threads, use the parfevalOnAll function to change the number of threads for all the workers in the pool and use the second argument of parfor to specify the number of workers to use. If you run this test on a pool of cluster workers, use the parcluster function to create pools with the required number of threads per worker. For an example of that process, see Scale Up to Cluster.
for j = 1:length(numWorkers)
    setNumCompThreads = parfevalOnAll(pool, ...
        @maxNumCompThreads,0,numThreads(j));
    fetchOutputs(setNumCompThreads);
    timer = tic;
    parfor (iteration = 1:numIterations,numWorkers(j))
        outPool = N*N;
    end
    tThreads(j) = toc(timer);
end

resetNumCompThreads = parfevalOnAll(pool,@maxNumCompThreads,0,1);
fetchOutputs(resetNumCompThreads);
Calculate the speedup ratios of each worker-thread combination by finding the ratios between the execution time when all the threads are on one worker and the execution times of the other combinations of workers and threads.
speedupThreads = tThreads(1)./tThreads;
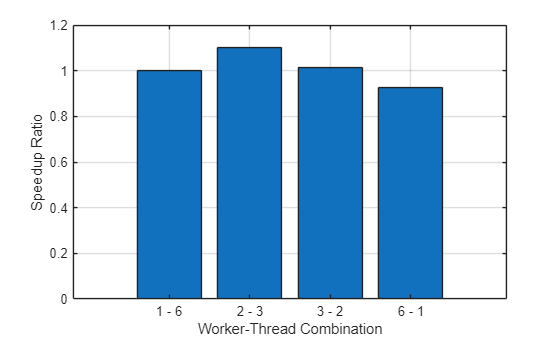
Compare the speedup ratios to identify which worker-thread combination yields the best performance. For this specific problem and hardware, the combination of two workers, each with three threads, performs better than the other combinations.
figure;
bar(speedupThreads);
x = compose("%d - %d",numWorkers',numThreads');
xticklabels(x);
xlabel("Worker-Thread Combination");
ylabel("Speedup Ratio");
grid on
Compare Execution Environments
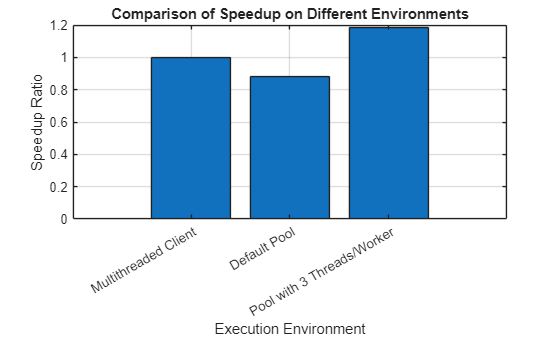
Calculate the speedup for each environment by finding the ratio of the execution time on the multithreaded client to the execution times of:
The default parallel pool with six single-threaded workers.
The optimized parallel pool with two workers, each using three threads.
[tOptPool,idx] = min(tThreads);
optNumThreads = numThreads(idx);
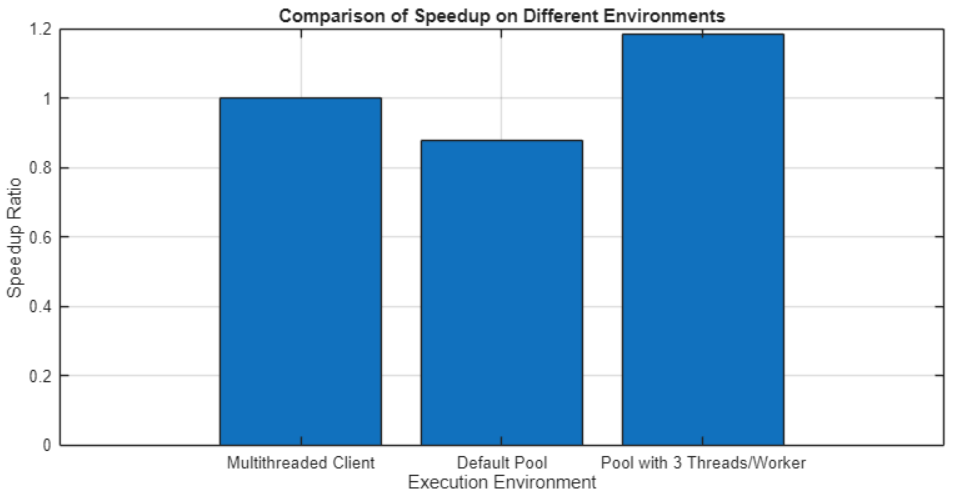
speedupEnvironments = tClient./[tClient,tPool,tOptPool];
Visualize the speedup across the different environments, normalized to the speedup on the multithreaded client, to identify which offers the best performance. For this problem, a parallel pool on the local machine with two workers and three threads per worker performs best.
figure;
bar(speedupEnvironments);
str = sprintf("Pool with %d Threads/Worker",optNumThreads);
xticklabels(["Multithreaded Client","Default Pool",str])
xlabel("Execution Environment");
ylabel("Speedup Ratio");
title("Comparison of Speedup on Different Environments");
grid on
Delete the pool to prepare for the next step.
delete(pool);
Scale Up to Cluster
If you have access to a remote cluster, you can calculate the scalability of the parfor-loop on workers with the optimal number of threads.
Create a parallel pool of 16 workers on a remote cluster. To request a parallel pool with the optimal number of threads per worker, create a parallel cluster object and set the NumThreads property. In the following code, replace myCluster with the name of your remote cluster profile.
numClusterWorkers = 16;
cluster = parcluster("myCluster");
cluster.NumThreads = optNumThreads;
pool = parpool(cluster,numClusterWorkers);
Starting parallel pool (parpool) using the 'myCluster' profile ... Connected to parallel pool with 16 workers.
As before, measure the execution time of the parfor-loop while running the same code with different numbers of workers. To specify the number of workers that execute the parfor-loop, use the second input argument of parfor.
clusterScale = zeros(1,numClusterWorkers);
for j = 1:numClusterWorkers
    timer = tic;
    parfor (iteration = 1:numIterations,j)
        outPool = N*N;
    end
    clusterScale(j) = toc(timer);
end
Calculate the speedup by computing the ratio between the execution time of a single worker and the execution time of the different numbers of workers.
speedupClusterScale = clusterScale(1)./clusterScale;
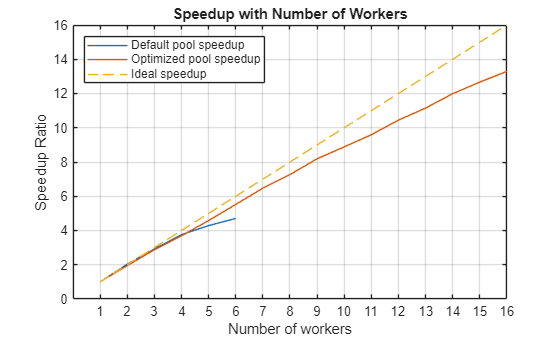
To visualize how the computations scale up with the number of workers, plot the speedup ratios against the number of workers. The results show that the scalability of the optimized pool is improved compared to the scalability of the default parallel pool.
figure;
plot(1:nT,speedupScale);
hold on
plot(1:numClusterWorkers,speedupClusterScale);
plot(1:numClusterWorkers,1:numClusterWorkers,"--");
hold off
title("Speedup with Number of Workers");
xlabel("Number of workers");
xticks(1:numClusterWorkers);
ylabel("Speedup Ratio");
legend("Default pool speedup","Optimized pool speedup", ...
    "Ideal speedup",Location="northwest")
grid on
When your computations are complete, delete the parallel pool on the remote cluster.
delete(pool);
Helper Functions
The findFactors function returns all divisors of a specified number. In effect, it lists potential worker counts that can evenly distribute the computational threads.
function factors = findFactors(n)
% Create an array of potential factors from 1 to n
potentialFactors = 1:n;
% Find index of potential factors if it divides n evenly
idx = mod(n,potentialFactors) == 0;
% Use logical indexing to find factors
factors = potentialFactors(idx);
end

