phased.HeterogeneousULA.plotResponse
Plot response pattern of array
Description
plotResponse(
plots the array response with additional options specified by one or more
array,FREQ,V,Name=Value)Name=Value pair arguments.
returns handles
of the lines or surface in the figure window, using any of the input arguments in the previous
syntaxes.hPlot = plotResponse(___)
Examples
Using a line plot, show the azimuth cut response of a 5-element heterogeneous uniform linear array along 0 degrees elevation. The plot shows the responses at operating frequencies of 200 MHz and 400 MHz.
Construct the array from z-directed and y-directed short dipole antenna elements.
sElement1 = phased.ShortDipoleAntennaElement(... FrequencyRange=[2e8 5e8], ... AxisDirection="Z"); sElement2 = phased.ShortDipoleAntennaElement(... FrequencyRange=[2e8 5e8], ... AxisDirection="Y"); sArray = phased.HeterogeneousULA(... ElementSet={sElement1,sElement2}, ... ElementIndices=[1 2 2 2 1]);
Plot the response.
fc = [3e8 4e8];
c = physconst("LightSpeed");
plotResponse(sArray,fc,c);
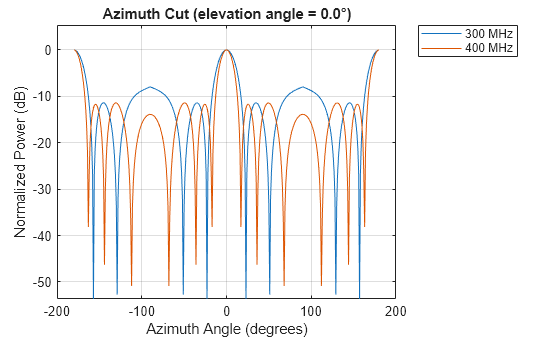
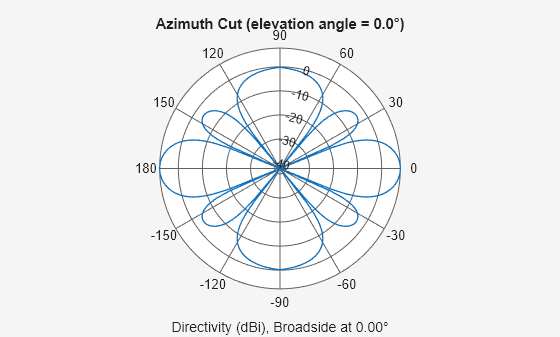
Construct a 5-element heterogeneous ULA of short-dipole antenna elements. Using the plotResponse method, plot the array's azimuth response in polar format. Assume each element's operating frequency spans 200-500 MHz and the wave propagation speed is the speed of light.
sElement1 = phased.ShortDipoleAntennaElement(... FrequencyRange=[2e8 5e8], ... AxisDirection="Z"); sElement2 = phased.ShortDipoleAntennaElement(... FrequencyRange=[2e8 5e8], ... AxisDirection="Y"); sArray = phased.HeterogeneousULA(... ElementSet={sElement1,sElement2}, ... ElementIndices=[1 2 2 2 1]);
Plot the response at 300 MHz.
fc = 3e8; c = physconst("LightSpeed"); plotResponse(sArray,fc,c,RespCut="Az",Format="Polar");

Plot the directivity of the array at 300 MHz.
plotResponse(sArray,fc,c,RespCut="Az",Format="Polar", ... Unit="dbi");

Construct a 9-element heterogeneous ULA of short-dipole antenna elements having different orientations. Assume each element response is in the frequency range 200-500 MHz. Using the plotResponse method, plot the array's azimuth response in polar format. Use the Weights parameter to set two different sets of tapering weights: a uniform tapering and a Taylor tapering. Use the AzimuthAngles parameter to restrict the display range from -45 to 45 degrees in 0.1 degree increments.
Construct the array.
sElement1 = phased.ShortDipoleAntennaElement(... FrequencyRange=[2e8 5e8], ... AxisDirection="Z"); sElement2 = phased.ShortDipoleAntennaElement(... FrequencyRange=[2e8 5e8], ... AxisDirection="Y"); sArray = phased.HeterogeneousULA(... ElementSet={sElement1,sElement2}, ... ElementIndices=[1 1 2 2 2 2 2 1 1]);
Plot the response at 300 MHz.
fc = 3e8; wts1 = ones(9,1); wts2 = taylorwin(9); c = physconst("LightSpeed"); plotResponse(sArray,fc,c,RespCut="Az", ... AzimuthAngles=[-45:0.1:45], ... Weights=[wts1,wts2]);

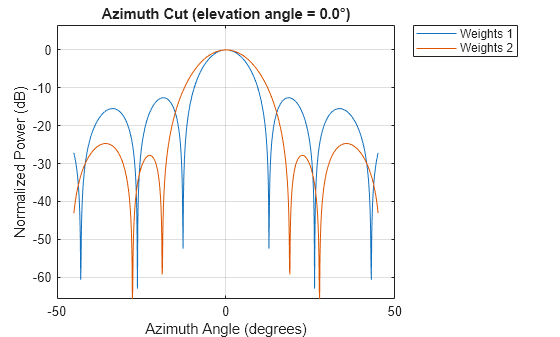
As expected, the tapered weighting broadens the mainlobe and reduces the sidelobes.
Input Arguments
Array object.
Data Types: double
Operating frequency in Hertz specified as a scalar or 1-by-K
row vector. Values must lie within the range specified by a property of
H. That property is named FrequencyRange
or FrequencyVector, depending on the type of element in the
array. The element has no response at frequencies outside that range. If you set the
RespCut property of H to
"3D", FREQ must be a scalar. When
FREQ is a row vector, plotResponse draws
multiple frequency responses on the same axes.
Data Types: double
Propagation speed in meters per second.
Data Types: double
Name-Value Arguments
Specify optional pairs of arguments as
Name1=Value1,...,NameN=ValueN, where Name is
the argument name and Value is the corresponding value.
Name-value arguments must appear after other arguments, but the order of the
pairs does not matter.
Before R2021a, use commas to separate each name and value, and enclose
Name in quotes.
Example:
plotResponse(sArray,fc,c,RespCut="Az",Format="Polar")
Cut angle as a scalar. If RespCut is "Az",
CutAngle must be between –90° and 90°. If RespCut is
"El", CutAngle must be between –180° and 180°.
Dependencies
To enable this property, RespCut must be set to
"Az" or "El".
Data Types: double
Format of the plot, using one of "Line", "Polar", or
"UV". If you set Format to "UV",
FREQ must be a scalar.
Data Types: string
Set this value to true to normalize the response pattern. Set this value
to false to plot the response pattern without normalizing it. This parameter
is not applicable when you set the Unit parameter value to
"dbi".
Data Types: logical
Set this value to true to overlay pattern cuts in a 2-D line plot. Set
this value to false to plot pattern cuts against frequency in a 3-D waterfall
plot. If this value is false, FREQ must be a vector with
at least two entries.
Dependencies
To enable this property, Format is not "Polar" and
RespCut is not "3D".
Data Types: logical
Specify the polarization options for plotting the array response pattern. The allowable
values are "None", "Combined", "H", and
"V" where
"None"specifies plotting a nonpolarized response pattern"Combined"specifies plotting a combined polarization response pattern"H"specifies plotting the horizontal polarization response pattern"V"specifies plotting the vertical polarization response pattern
For arrays that do not support polarization, the only allowed value is
"None". This parameter is not applicable when you set the
Unit parameter value to "dbi".
Data Types: char | string
Cut of the response. Valid values depend on Format, as follows:
If
Formatis"Line"or"Polar", the valid values ofRespCutare"Az","El", and"3D". The default is"Az".If
Formatis"UV", the valid values ofRespCutare"U"and"3D". The default is"U".
If you set RespCut to "3D",
FREQ must be a scalar.
Data Types: char | string
The unit of the plot. Valid values are "db", "mag",
"pow", or "dbi". This parameter determines the type of
plot that is produced.
| Unit value | Plot type |
|---|---|
db | power pattern in dB scale |
mag | field pattern |
pow | power pattern |
dbi | directivity |
Data Types: string
Weight values applied to the array, specified as a length-N column
vector or N-by-M matrix. The dimension
N is the number of elements in the array. The interpretation of
M depends upon whether the input argument FREQ is a
scalar or row vector.
| Weights Dimensions | FREQ Dimension | Purpose |
|---|---|---|
| N-by-1 column vector | Scalar or 1-by-M row vector | Apply one set of weights for the same single frequency or all M frequencies. |
| N-by-M matrix | Scalar | Apply all of the M different columns in
Weights for the same single frequency. |
| 1-by-M row vector | Apply each of the M different columns in
Weights for the corresponding frequency in
FREQ. |
Data Types: double
Azimuth angles for plotting array response, specified as a row vector. The
AzimuthAngles parameter sets the display range and resolution of azimuth
angles for visualizing the radiation pattern. The values of azimuth angles should lie between
–180° and 180° and must be in nondecreasing order. When you set the
RespCut parameter to "3D", you can set the
AzimuthAngles and ElevationAngles parameters
simultaneously.
Dependencies
To enable this property, the RespCut parameter must be set to
"Az" or "3D" and the Format
parameter is set to "Line" or "Polar".
Data Types: double
Elevation angles for plotting array response, specified as a row vector. The
ElevationAngles parameter sets the display range and resolution of
elevation angles for visualizing the radiation pattern. The values of elevation angles should
lie between –90° and 90° and must be in nondecreasing order. When you set the
RespCut parameter to "3D", you can set the
ElevationAngles and AzimuthAngles parameters
simultaneously.
Dependencies
To enable this property, the RespCut parameter must be set to
"El" or "3D" and the Format
parameter is set to "Line" or "Polar".
Data Types: double
U coordinate values for plotting array response, specified as a row vector.
The UGrid parameter sets the display range and resolution of the
U coordinates for visualizing the radiation pattern in
U/V space. The values of UGrid should be between –1 and
1 and should be specified in nondecreasing order. You can set the UGrid and
VGrid parameters simultaneously.
Dependencies
To enable this property, the Format parameter must be set to
"UV" and the RespCut parameter is set to
"U" or '3D'.
Data Types: double
V coordinate values for plotting array response, specified as a row
vector. The VGrid parameter sets the display range and resolution of the
V coordinates for visualizing the radiation pattern in
U/V space. The values of VGrid should be between –1 and
1 and should be specified in nondecreasing order. You can set VGrid and
UGrid parameters simultaneously.
Dependencies
To enable this property, the Format parameter must be set to
"UV" and the RespCut parameter is set to
"3D".
Data Types: double
Version History
Introduced in R2013a
MATLAB Command
You clicked a link that corresponds to this MATLAB command:
Run the command by entering it in the MATLAB Command Window. Web browsers do not support MATLAB commands.
选择网站
选择网站以获取翻译的可用内容,以及查看当地活动和优惠。根据您的位置,我们建议您选择:。
您也可以从以下列表中选择网站:
如何获得最佳网站性能
选择中国网站(中文或英文)以获得最佳网站性能。其他 MathWorks 国家/地区网站并未针对您所在位置的访问进行优化。
美洲
- América Latina (Español)
- Canada (English)
- United States (English)
欧洲
- Belgium (English)
- Denmark (English)
- Deutschland (Deutsch)
- España (Español)
- Finland (English)
- France (Français)
- Ireland (English)
- Italia (Italiano)
- Luxembourg (English)
- Netherlands (English)
- Norway (English)
- Österreich (Deutsch)
- Portugal (English)
- Sweden (English)
- Switzerland
- United Kingdom (English)