Points
R2026bDescription
A Points object represents a point cloud in a pcviewer scene.
The addPointCloud
object function returns a Points object when you add a point cloud to a
pcviewer
object. You can use the properties of the Points object to access the
associated point cloud data and control the appearance and behavior of the point cloud in the
scene.
Properties
This property is read-only.
Point cloud data, specified as a pointCloud object.
Color for points in the point cloud, specified as a short name, long name, RGB
triplet, an M-by-3 matrix, or an
M-by-N-by-3 array. The
color input sets the Color property. For
more information on color values, see Color Values on the
pcviewer
reference page.
If the data type of the
Locationproperty of the input point cloud issingleordouble, each RGB value must be in the range [0, 1].If the data type of the
Locationproperty of the input point cloud isuint8, eachcolorRGB value must be in the range [0, 255].The
Colorproperty of thePointsobject stores thecolorvalue as an RGB triplet, an M-by-3 matrix, or an M-by-N-by-3 array. If you specify one or more color names, the function converts them to their corresponding RGB triplets.
| Color | Format | Example |
|---|---|---|
| Specify one color for all points | Short or long color name. |
|
RGB triplet, as a 1-by-3 vector. |
| |
| Specify a color for each point | Vector of strings, or cell array of character vectors of color names. |
|
M-by-3 matrix for an unorganized point cloud, in which each row is an RGB triplet. M is the number of rows in the unorganized point cloud. | 255 0 0 255 0 0 0 255 255 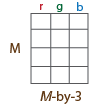 | |
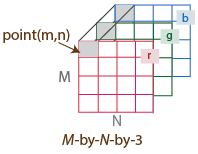
M-by-N-by-3 array for an organized point cloud, in which each page specifies the red, green, or blue value for the corresponding point in the point cloud. M-by-N is the size of the organized point cloud. |
|

Source of the color data, specified as one of:
"auto"— Uses theColorproperty of the input point cloud, if available. Otherwise, uses"Intensity"if available. If neither is available, uses the z-coordinates of the vertices."X"— Use the x-coordinates of the vertices."Y"— Use the y-coordinates of the vertices."Z"— Use the z-coordinates of the vertices."Color"— Use RGB color values stored in the point cloud."Intensity"— Use intensity values stored in the point cloud."Row"— Use row indices of an organized point cloud."Column"— Use column indices of an organized point cloud.."Range"— Use range values when available."Azimuth"— Use azimuth values stored in the point cloud."Elevation"— Use elevation values stored in the point cloud."Custom"— Use the values specified by theColorproperty.
Point size, specified as a positive scalar in pixels.
Transformation applied to the point cloud in the scene, specified as a rigidtform3d (Image Processing Toolbox),
affinetform3d (Image Processing Toolbox), simtform3d (Image Processing Toolbox),
or transltform3d (Image Processing Toolbox).
Transparency of point cloud, specified as a numeric scalar in the range
[0,1].
Display point cloud in scene, specified as "on" or
"off", or as a numeric or logical 0
(false) or 1 (true). A value
of "on" is equivalent to true and shows the points
magnified. A value of "off" is equivalent to false
and shows points unmagnified, as they would appear from the position of the
camera.
Examples
Download two point cloud tiles from the U.S. Geological Survey (USGS) 3D Elevation Program (3DEP) [1], covering the University of Utah campus and adjacent Wasatch Mountain foothills. Visualize each tile individually, then combine them in a single viewer using the addPointCloud method.
baseURL = "https://rockyweb.usgs.gov/vdelivery/Datasets/Staged/Elevation/LPC/Projects/Wasatch_Fault_UT_LiDAR/UT_Wasatch_L4_2013/LAZ/";

tiles = [
    "USGS_LPC_Wasatch_Fault_UT_LiDAR_12TVL2900012000.laz"
    "USGS_LPC_Wasatch_Fault_UT_LiDAR_12TVL3000012000.laz"
];
Download the tiles if they are not already cached locally.
for i = 1:numel(tiles)
    localFile = fullfile(tempdir, tiles(i));
    if ~exist(localFile,"file")
        websave(localFile, baseURL + tiles(i));
    end
end
Read the two tiles as point clouds.
reader1 = lasFileReader(fullfile(tempdir, tiles(1)));
pc1 = readPointCloud(reader1);

reader2 = lasFileReader(fullfile(tempdir, tiles(2)));
pc2 = readPointCloud(reader2);
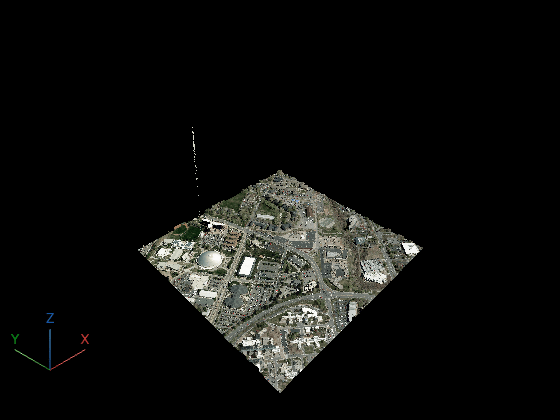
Visualize the first tile in its own pcviewer instance.
pcview1 = pcviewer(pc1);
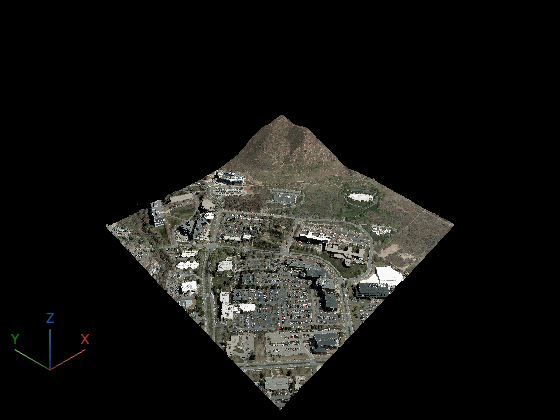
Visualize the second tile in its own pcviewer instance.
pcview2 = pcviewer(pc2);
Use addPointCloud to add the second point cloud to a viewer that already displays the first. This avoids concatenating the point clouds and lets you control each one independently.
pcview = pcviewer(pc1);
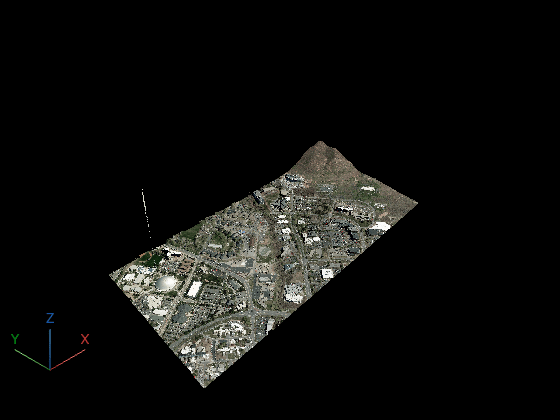
addPointCloud(pcview, pc2);
References
[1] USGS Lidar Point Cloud UT_Wasatch_L4_2013 courtesy of the U.S. Geological Survey
Version History
Introduced in R2026b

