Main Content

passivity

Plot passivity of S-parameters object

Description

passivity(s) plots the passivity of S-parameter object, s over a range of frequencies specified in s.Frequencies. Passivity is measured by the two-norm of the frequency-dependent transfer function H(f).

example

[ns,violationindex] = passivity(s) plots the passivity and returns the data of the passivity plot.

Examples

collapse all

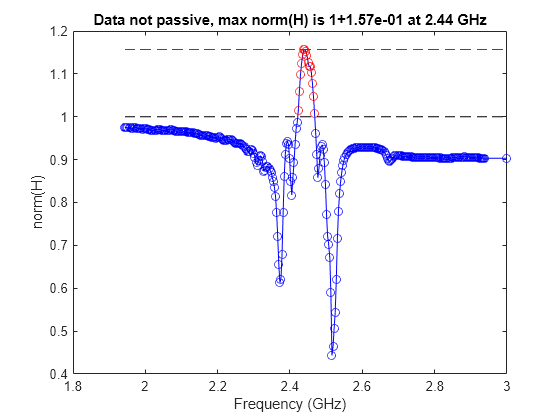
Read the file, sawfilter.s2p.

S = sparameters('sawfilter.s2p');

Plot the passivity of the 2-by-2 S-parameters.

passivity(S)

Figure contains an axes object. The axes object with title Data not passive, max norm(H) is 1+1.57e-01 at 2.44 GHz, xlabel Frequency (GHz), ylabel norm(H) contains 4 objects of type line. One or more of the lines displays its values using only markers

Input Arguments

collapse all

S-parameters, specified as an RF Toolbox™ s-parameter function object. To create this type of object, use the sparameters function.

Output Arguments

collapse all

Two-norm transfer function H(f) at each frequency in s.Frequencies, returned as a column vector.

Data Types: double

Frequencies indices where passivity is violated (norm(H)>1), returned as a column vector.

Data Types: double

Version History

Introduced in R2019a