主要内容

risk.validation.areaUnderCurveTest

Area under curve test

Since R2026a

    Description

    hAUCTest = risk.validation.areaUnderCurveTest(BaselineScore,BaselineBinaryResponse,TargetScore,TargetBinaryResponse) returns the result of an area under curve (AUC) test, which compares scores and responses in a baseline and target portfolio. The output is 1 if the test rejects the null hypothesis at the 95% confidence level, or 0 otherwise.

    example

    hAUCTest = risk.validation.areaUnderCurveTest(BaselineScore,BaselineBinaryResponse,TargetScore,TargetBinaryResponse,Name=Value) specifies additional options using one or more name-value arguments. For example, you can specify the confidence level for the test.

    [hAUCTest,Output] = risk.validation.areaUnderCurveTest(___) also returns a structure Output that contains a table of summary metrics.

    Examples

    collapse all

    Perform an AUC test on customer probability of default (PD) data to determine if the AUC for a baseline portfolio is smaller than the AUC for a target portfolio. The PDRatingGradeData file contains a table with variables PD, RatingGrade, ObservationYear, and Default. These variables, respectively, contain data for customer probability of default (PD), rating grade, observation year, and whether the customer defaulted.

    Load the data.

    data = readtable("PDRatingGradeData.csv")
    data=500×4 table
           PD       RatingGrade    ObservationYear    Default
        ________    ___________    _______________    _______
    
         0.40736         9              2020             0   
          0.4529        10              2020             0   
        0.063493         2              2020             0   
         0.45669        10              2020             1   
         0.31618         7              2020             0   
         0.04877         1              2020             0   
         0.13925         3              2020             0   
         0.27344         6              2020             0   
         0.47875        10              2020             0   
         0.48244        10              2020             0   
        0.078807         2              2020             0   
          0.4853        10              2020             0   
         0.47858        10              2020             0   
         0.24269         5              2020             0   
         0.40014         9              2020             0   
        0.070943         2              2020             0   
          ⋮


    Create two logical vectors indicating the observations that belong to the baseline portfolio and the observations that belong to the target portfolio.

    baselineElem = data.ObservationYear==2023;
    targetElem = data.ObservationYear==2024;

    Create vectors from the rating grade and binary response data for the baseline and target portfolios.

    BaselineScore = data.RatingGrade(baselineElem);
    TargetScore = data.RatingGrade(targetElem);
    BaselineBinaryResponse = data.Default(baselineElem);
    TargetBinaryResponse = data.Default(targetElem);

    Calculate the x- and y-coordinates of the receiver operating characteristic (ROC) curve for each portfolio by using the perfcurve function. Plot the ROC curves together.

    [XB,YB] = perfcurve(BaselineBinaryResponse,BaselineScore,1);
    [XT,YT] = perfcurve(TargetBinaryResponse,TargetScore,1);
    plot(XB,YB,"o-m")
    hold on
    plot(XT,YT,"o-g")
    xlabel("False Positive Rate (FPR)")
    ylabel("True Positive Rate (TPR)")
    legend("Baseline portfolio","Target portfolio",Location="northwest")

    Figure contains an axes object. The axes object with xlabel False Positive Rate (FPR), ylabel True Positive Rate (TPR) contains 2 objects of type line. These objects represent Baseline portfolio, Target portfolio.

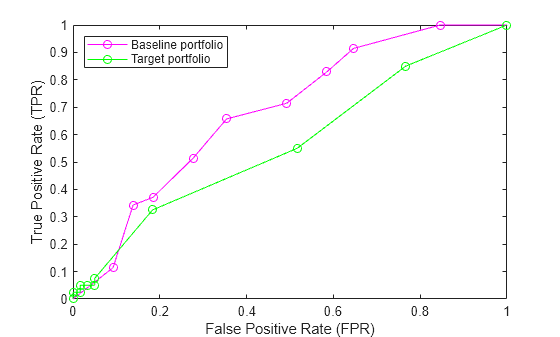
    The plot shows that the curve for the target portfolio is mostly below the curve for the baseline portfolio.

    Use the areaUnderCurveTest function with the fully qualified namespace risk.validation to perform an area under curve test on the baseline and target portfolio data.

    risk.validation.areaUnderCurveTest(BaselineScore,BaselineBinaryResponse, ...
        TargetScore,TargetBinaryResponse)
    ans = logical
       1


    The output shows that enough evidence exists to reject the null hypothesis that the AUC for the baseline portfolio is smaller than the AUC for the target portfolio. This result is consistent with the ROC curve for the target portfolio being under the ROC curve for the baseline portfolio.

    Input Arguments

    collapse all

    Baseline portfolio scores, specified as a numeric vector. BaselineScore must be of the same data type as TargetScore and the same size as BaselineBinaryResponse.

    The baseline scores are sometimes called the initial scores.

    Data Types: single | double

    Baseline portfolio responses, specified as a numeric or logical vector, containing values of 1 (true) or 0 (false). The baseline responses, sometimes called the initial responses, represent the predicted state for each value in BaselineScore. For example, you can use the baseline responses to represent whether or not a member of the portfolio has defaulted.

    BaselineBinaryResponse and BaselineScore must be the same size.

    Data Types: single | double | logical

    Target portfolio scores, specified as a numeric vector. TargetScore must be of the same type as BaselineScore and the same size as TargetBinaryResponse.

    The target scores are sometimes called the current scores.

    Data Types: single | double

    Target portfolio responses, specified as a numeric or logical vector, containing values of 1 (true) or 0 (false). The target responses, sometimes called the current responses, represent the predicted state for each value in TargetScore. For example, you can use the target responses to represent customer defaults.

    TargetBinaryResponse and TargetScore must be the same size.

    Data Types: single | double | logical

    Name-Value Arguments

    collapse all

    Specify optional pairs of arguments as Name1=Value1,...,NameN=ValueN, where Name is the argument name and Value is the corresponding value. Name-value arguments must appear after other arguments, but the order of the pairs does not matter.

    Example: risk.validation.areaUnderCurve(BaselineCreditScore,BaselineBinaryResponse,TargetCreditScore,TargetBinaryResponse,ConfidenceLevel=0.99,SortDirection="ascending") specifies a 99% confidence level for the test and indicates that lower credit scores indicate greater risk.

    Confidence level of the hypothesis test, specified as a numeric scalar in the range (0,1).

    Example: ConfidenceLevel=0.99

    Direction of increasing risk, specified as "descending" or "ascending". When you specify SortDirection as "descending", higher scores indicate a greater risk of an event. When you specify SortDirection as "ascending", lower scores indicate greater risk.

    For example, if BaselineScore and TargetScore contain credit scores, SortDirection should be "ascending" because lower scores indicate higher risk. On the other hand, if BaselineScore and TargetScore contain probability of default (PD) values, SortDirection should be "descending" because higher probabilities indicate higher risk.

    Example: SortDirection="ascending"

    Data Types: string | char

    Output Arguments

    collapse all

    Hypothesis test results, returned as a logical vector.

    • A value of 1 rejects the null hypothesis at the specified confidence level.

    • A value of 0 fails to reject the null hypothesis at the specified confidence level.

    Output metrics, returned as a structure with the following fields:

    • RejectTest — Logical scalar indicating whether the null hypothesis was rejected. This field represents the same values as hAUCTest.

    • PValuep-value for the hypothesis test returned as a scalar in the range [0,1]. A small value indicates that the null hypothesis might not be valid.

    • TestStatistic — Value of the test statistic for the hypothesis test, returned as a numeric scalar.

    • CriticalValue — Minimum test statistic at which the test rejects the null hypothesis for the given probability and confidence level, returned as a numeric scalar.

    • BaselineAUC — AUC for the baseline portfolio, returned as a numeric scalar.

    • BaselineAUCVariance — Estimated variance of the AUC for the baseline portfolio, returned as a numeric scalar.

    • BaselineTrials — Number of observations in the baseline portfolio returned as a numeric scalar.

    • TargetAUC — AUC for the target portfolio, returned as a numeric scalar.

    • TargetAUCVariance — Estimated variance of the AUC for the target portfolio, returned as a numeric scalar.

    • TargetTrials — Number of observations in the target portfolio, returned as a numeric scalar.

    • MeanBaselineScore — Mean of the observations in BaselineScore, returned as a numeric scalar.

    • MeanBaselineResponse — Mean of the observations in BaselineBinaryResponse, returned as a numeric scalar.

    • MeanTargetScore — Mean of the observations in TargetScore, returned as a numeric scalar.

    • MeanTargetResponse — Mean of the observations in TargetBinaryResponse, returned as a numeric scalar.

    • ConfidenceLevel — Confidence level for the hypothesis test, returned as a numeric scalar.

    For more information about the AUC test and its corresponding statistics, see More About.

    More About

    collapse all

    References

    [1] European Central Bank, “Instructions for reporting the validation results of internal models.” February, 2019. https://www.bankingsupervision.europa.eu/activities/internal_models/shared/pdf/instructions_validation_reporting_credit_risk.en.pdf.

    Version History

    Introduced in R2026a