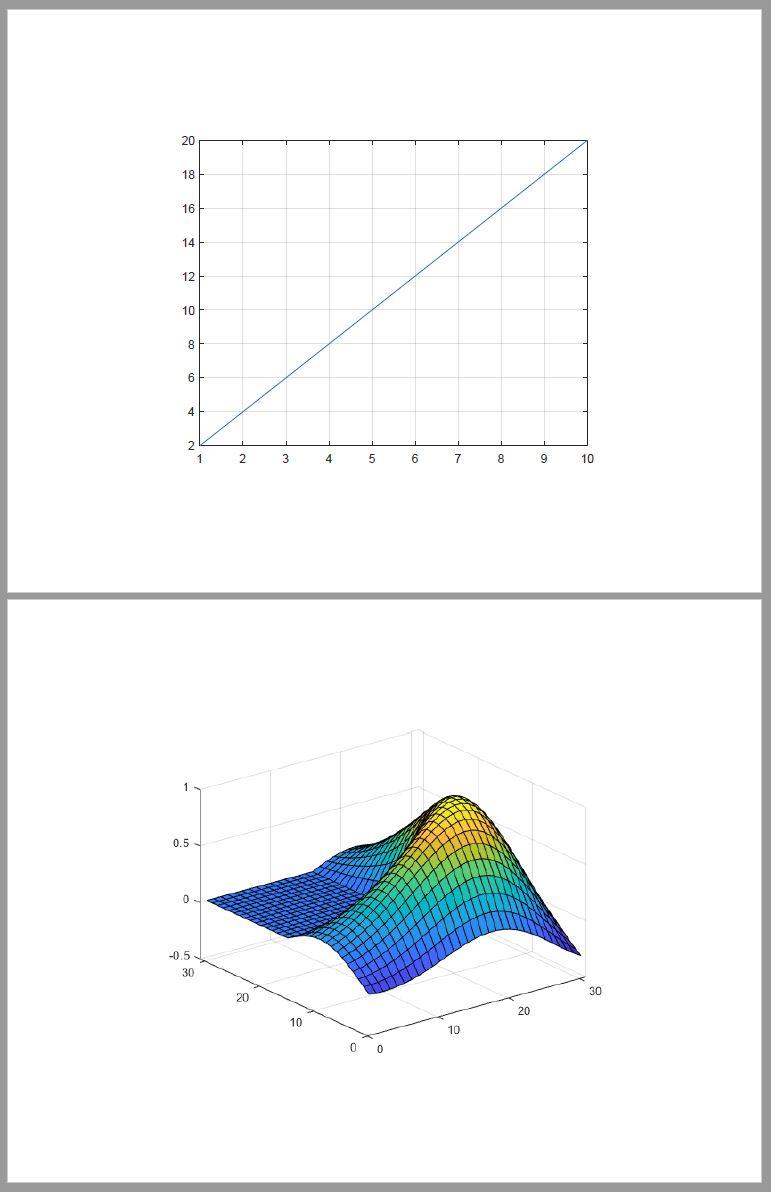
页面中心图片快照
此示例显示如何将图窗快照置于 PDF 和 Microsoft® Word 报告的横向页面的中心。
该示例创建一个具有横向布局的报告 API 报告,创建 MATLAB 图窗,然后使用 centerFigure 本地函数在页面中心创建并添加这些图窗的快照。

创建报告
导入 DOM 和报告 API 包,这样您就不必使用长而完全限定的类名。
import mlreportgen.dom.*
import mlreportgen.report.*
创建 PDF 报告。要创建 Microsoft® Word 报告,请将 "pdf" 更改为 "docx"。
rpt = Report("myreport","pdf");
open(rpt);
更新报告页面布局
创建页面布局对象。
if strcmpi(rpt.Type,"pdf")
    pageLayoutObj = PDFPageLayout;
else
    pageLayoutObj = DOCXPageLayout;
end
指定页面方向、高度和宽度。
pageLayoutObj.PageSize.Orientation = "landscape";
pageLayoutObj.PageSize.Height = "8.5in";
pageLayoutObj.PageSize.Width = "11in";
指定页边距。
pageLayoutObj.PageMargins.Top = "0.5in";
pageLayoutObj.PageMargins.Bottom = "0.5in";
pageLayoutObj.PageMargins.Left = "0.5in";
pageLayoutObj.PageMargins.Right = "0.5in";

pageLayoutObj.PageMargins.Header = "0.3in";
pageLayoutObj.PageMargins.Footer = "0.3in";
将页面布局对象添加到报告中。
add(rpt,pageLayoutObj);
创建并添加图窗
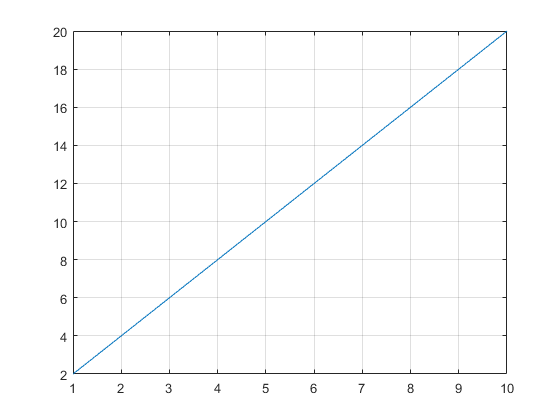
创建一个具有线性图的图窗。
f = figure();
plot(1:1:10,2:2:20);
grid on;
调用 centerFigure 本地函数将图窗快照添加到页面中心。然后,删除图窗对象。
centerFigure(f,rpt);

delete(f);
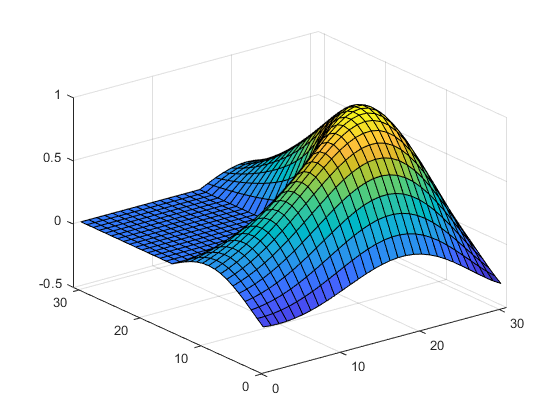
类似地,在页面中心添加膜表面图快照。
centerFigure(surf(membrane),rpt);

delete(gcf);
生成报告
关闭并查看报告。
close(rpt);
rptview(rpt);
centerFigure 局部函数
此函数创建指定图窗的快照并将其添加到指定报告中页面的中心。该函数使用报告 API Figure 报告器来获取图窗快照并使用不可见的 DOM Table 进行布局。
function centerFigure(figure,rpt)导入 DOM API、报告 API 和报告生成器工具包,这样您就不必使用长而完全限定的类名。
    import mlreportgen.dom.*
    import mlreportgen.report.*
    import mlreportgen.utils.*
获取报告的当前页面布局以确定当前页面大小和页边距。页面布局信息用于计算页面主体大小,以便确定后续步骤中创建的布局表的大小。
    pageLayout = getReportLayout(rpt);
    pageSize = pageLayout.PageSize;
    pageMargins = pageLayout.PageMargins;
计算页面主体宽度。页面主体宽度表示可用于内容的页面宽度,是通过从页面宽度中减去左右边距大小来确定的。对于 DOCX 输出,还需要减去装订线大小。
    bodyWidth = units.toInches(pageSize.Width) - ...
        units.toInches(pageMargins.Left) - ...
        units.toInches(pageMargins.Right);

    if strcmpi(rpt.Type,"docx")
        bodyWidth = bodyWidth - ...
            units.toInches(pageMargins.Gutter);
    end
    bodyWidth = sprintf("%0.2fin",bodyWidth);
计算页面主体高度。页面主体高度表示可用于内容的页面高度,通过从页面高度中减去顶部和底部边距大小来确定。对于 PDF 输出,还需要减去页眉和页脚大小,因为正文从页眉的底部延伸到页脚的顶部。
    bodyHeight = units.toInches(pageSize.Height) - ...
        units.toInches(pageMargins.Top) - ...
        units.toInches(pageMargins.Bottom);

    if strcmpi(rpt.Type,"pdf")
        bodyHeight = bodyHeight - ...
            units.toInches(pageMargins.Header) - ...
            units.toInches(pageMargins.Footer);
    end
    bodyHeight = sprintf("%0.2fin",bodyHeight);
为指定的图窗创建一个 Figure 对象。然后,创建一个包装图窗快照图像文件的 Image 对象。缩放图像以适合后续步骤中创建的布局表的条目。
    fig = Figure(figure);
    figImg = Image(getSnapshotImage(fig,rpt));
    figImg.Style = [figImg.Style {ScaleToFit}];
将图像包装在段落中,因为 PDF 要求图像必须位于段落中。更新段落样式以确保图像周围没有空白。
    para = Paragraph(figImg);
    para.Style = [para.Style {OuterMargin("0in","0in","0in","0in")}];
在 1×1 的不可见布局表 (lo_table) 中添加包含图窗快照的段落。如果未定义表格及其表格条目的边框,则该表格被视为不可见。
lo_table = Table({para});将表扩展到可用的页面主体宽度。
lo_table.Width = bodyWidth;
将唯一的表条目跨越至可用的页体高度。另外,指定垂直和水平对齐格式,以确保图像在表条目内垂直和水平居中。
    lo_table.TableEntriesStyle = [lo_table.TableEntriesStyle ...
        { ...
        Height(bodyHeight), ...
        HAlign("center"), ...
        VAlign("middle") ...
        }];
将布局表添加到报告中。
    add(rpt,lo_table);
end
另请参阅
mlreportgen.report.Report | mlreportgen.dom.PDFPageLayout | mlreportgen.dom.DOCXPageLayout | getReportLayout | mlreportgen.utils.units | mlreportgen.report.Figure | mlreportgen.dom.Table