使用报告资源管理器创建报告
此示例演示了如何使用报告资源管理器创建报告。本报告解释了幻方阵,即各列、各行和对角线相加均相等的矩阵。有关详细信息,请参阅magic。
创建报告设置文件
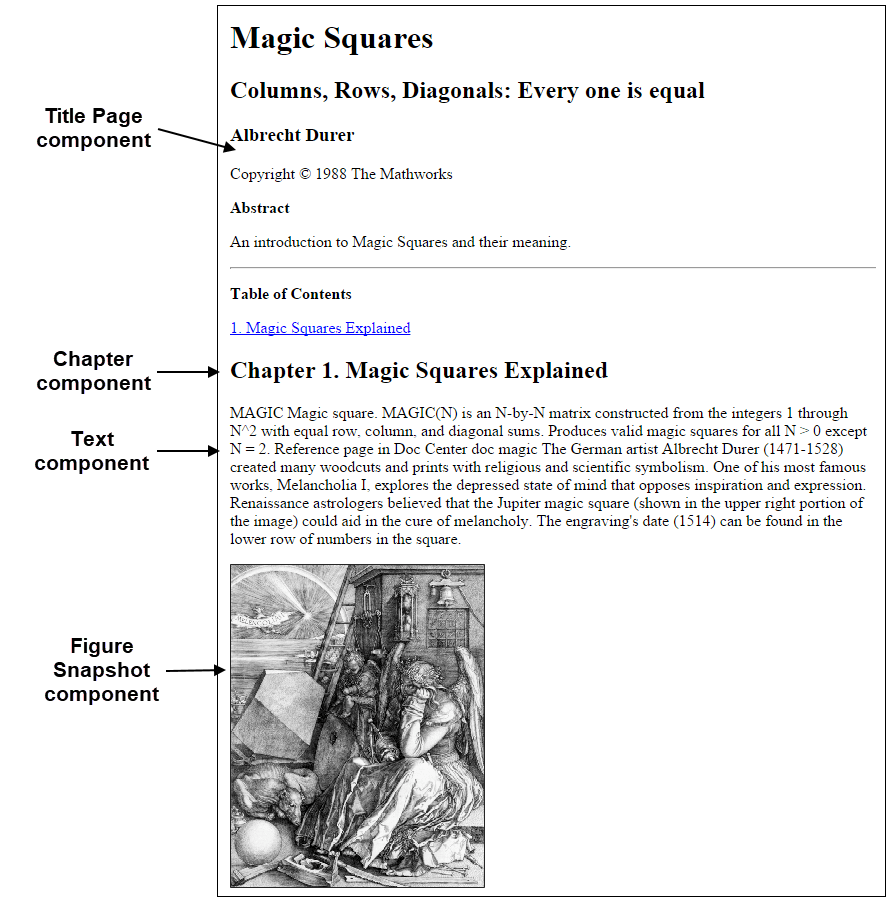
要设置报告,您需要创建一个设置文件,并添加组件,这些组件是描述报告内容的 MATLAB® 对象。例如,此示例中的完成报告使用组件创建了标题页、章节、正文和图窗。
提示:要打开此示例的已完成报告设置文件,在 MATLAB 命令行窗口中,输入:
setedit magic-square.rpt
要创建报告设置文件:
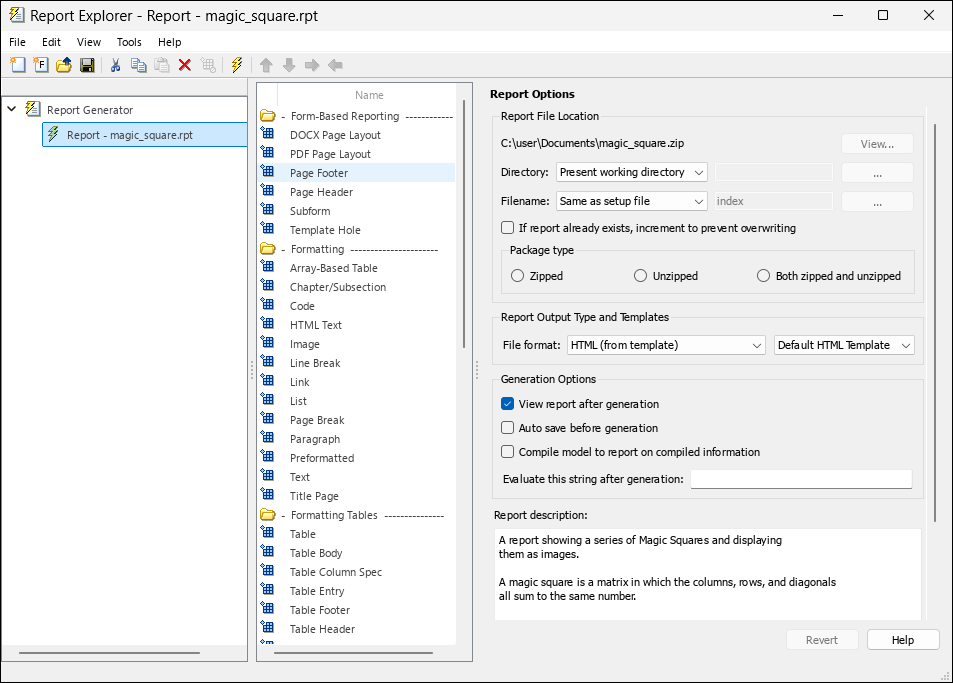
1.打开报告资源管理器。在 MATLAB 工具条的 App 选项卡中的数据库连接和报告部分,点击报告生成器。
2.选择文件 > 新建以创建报告设置文件。新的报告设置的默认名称为 Unnamed.rpt。
3.在“报告资源管理器”的右侧窗格中,为报告设置以下属性:
要将报告保存到当前工作文件夹中,请将目录设置为
Present working directory。要以 HTML 格式生成报告输出,请将文件格式设置为
HTML (from template)。使用此选项可添加一个目录,您可以在报告中展开和折叠该目录。在报告描述框中,输入以下文本:
This report creates a series of magic squares
and displays them as images.

A magic square is a matrix in which the
columns, rows, and diagonal add up to the
same number.
4.要保存报告,请选择文件 > 另存为,然后为报告设置文件命名 magic_square.rpt。在左侧窗格中,新文件名显示在报告生成器下。
指定报告变量
要指定要显示的方块的数量和大小,以及是否将幻方显示为数值数组或彩色方块图像,请使用 Evaluate MATLAB Expression 组件在 MATLAB 工作区中创建这些变量:
变量
magicSizeVector指定一个幻方大小数组。变量
largestDisplayedArray指定要显示的最大幻方的大小,以数值数组的形式表示。
要将组件添加到设置文件中:
1.在“报告资源管理器”的左侧窗格中,选择报告设置文件。
2.在中间窗格的 MATLAB 部分,选择评估 MATLAB 表达式。
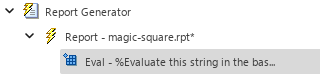
3.在右侧窗格中,点击将组件添加到当前报告。左侧窗格显示了 magic_squares 报告下的新组件。
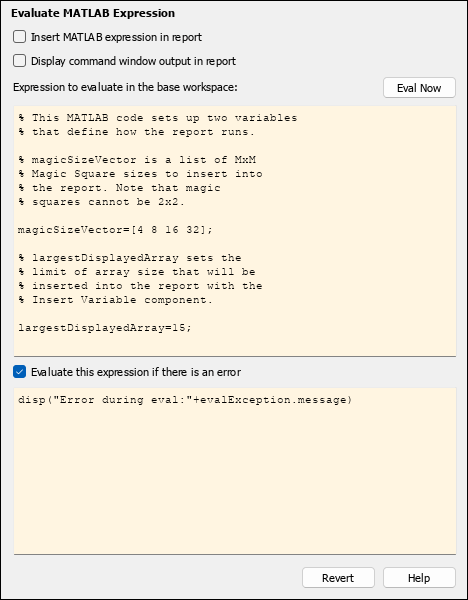
4.在右侧窗格中,为 Eval 组件指定以下属性:
要从报告中排除 MATLAB 代码详细信息和输出,请清除在报告中插入 MATLAB 表达式和在报告中显示命令行窗口输出复选框。
要定义变量
magicSizeVector和largestDisplayedArray,在要在基础工作区中计算的表达式框中,输入以下 MATLAB 代码:
% This MATLAB code sets up two variables
% that define how the report runs.

% magicSizeVector is a list of MxM
% Magic Square sizes to insert into
% the report. Note that magic
% squares cannot be 2x2.

magicSizeVector=[4 8 16 32];

% largestDisplayedArray sets the
% limit of array size that will be
% inserted into the report with the
% Insert Variable component.

largestDisplayedArray=15;
如果上一步的命令执行失败,则显示错误。在如果出现错误,则评估此表达式框中,输入以下代码:
disp("Error during eval:"+evalException.message)
创建标题页
要创建报告的标题页,请使用 Title Page 组件:
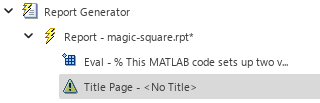
1.在左侧窗格中,选择 Eval 组件。
2.在中间窗格的格式部分,选择标题页组件。然后,在右侧窗格中,点击将组件添加到当前报告。
在左侧窗格中,图标 ![]() 表示 Eval 组件不能有子组件,因此 Title Page 组件是 Eval 组件的同级组件。
表示 Eval 组件不能有子组件,因此 Title Page 组件是 Eval 组件的同级组件。
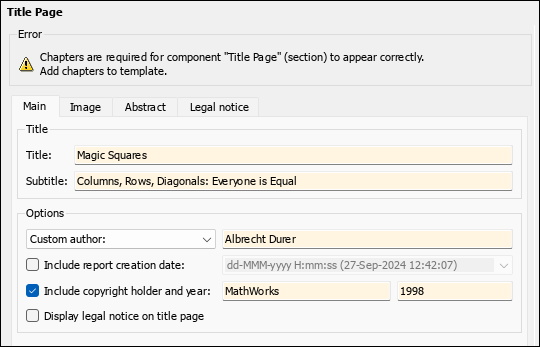
3.在右侧窗格的主选项卡中,为标题页组件指定以下属性:
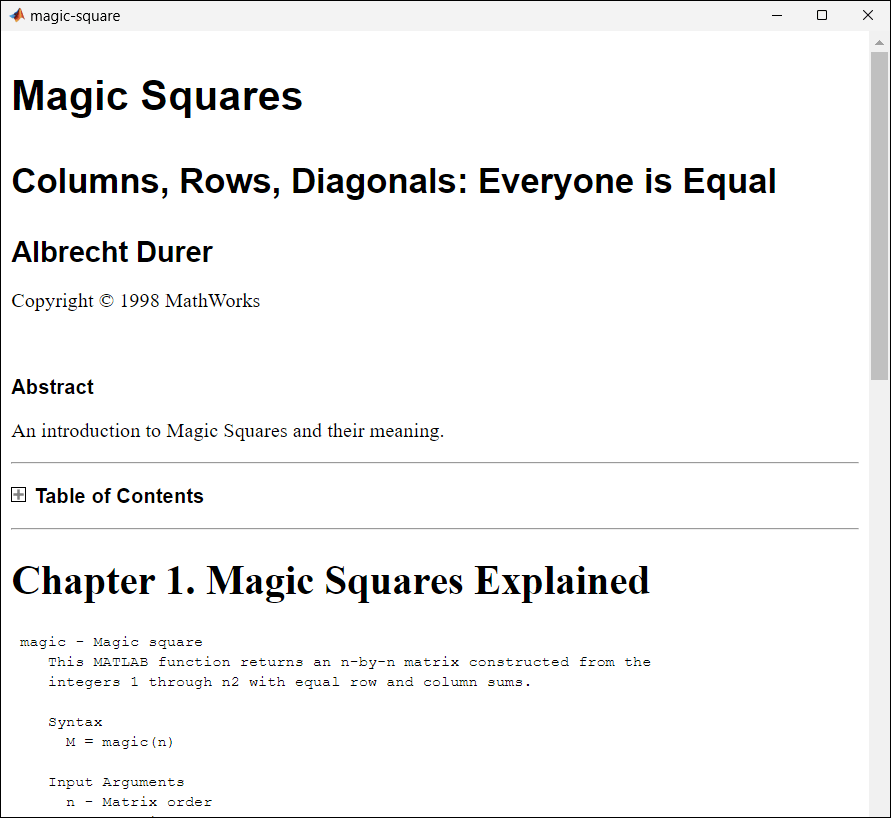
将标题设置为
Magic Squares。将子标题设置为
Columns, Rows, Diagonals: Everyone is Equal。在选项下,选择
Custom author。然后,在右侧的框中输入Albrecht Durer。阿尔布雷希特·丢勒 (Albrecht Dürer) 创作了一幅包含幻方的蚀刻画。清除包括报告创建日期复选框。
选中包括版权所有者和年份复选框。然后,在右侧的框中输入
The MathWorks和1988。
4.在摘要选项卡的摘要文本下,输入:
An introduction to Magic Squares and their meaning.

添加第一章
要向报告添加一章,请使用 Chapter/Subsection 组件:
1.在左侧窗格中,选择标题页组件。
2.在中间窗格的格式部分,选择章节/小节组件。然后,在右侧窗格中,点击将组件添加到当前报告。左侧窗格显示 Eval、标题页和章节组件,它们彼此为同级组件。
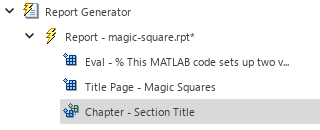
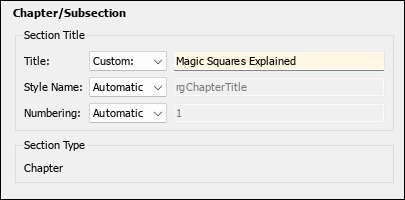
3.在右侧窗格中,对于标题,选择 Custom。然后,在右侧的框中输入 Magic Squares Explained。
在第一章开头添加引言
要在第一章中包含引言文本,请添加 Paragraph 和 Text 组件:
1.在左侧窗格中,选择章节组件。
2.在中间窗格的格式部分,添加一个段落组件和两个文本组件。
在左侧窗格中,图标 ![]() 表示 Chapter 和 Paragraph 组件可以有子组件,因此新 Text 组件是 Paragraph 组件的子组件,而后者是 Chapter 组件的子组件。
表示 Chapter 和 Paragraph 组件可以有子组件,因此新 Text 组件是 Paragraph 组件的子组件,而后者是 Chapter 组件的子组件。
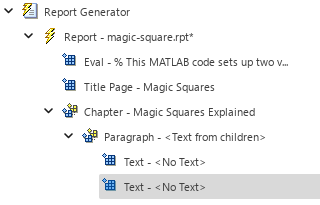
3.在左侧窗格中,选择第一个文本组件。然后,在右窗格的要包含在报告中的文本框中,输入:
%<help("magic")>
分隔符 %< 和 > 评估 MATLAB 代码并将结果插入报告。在此示例中,该命令显示关于 magic 函数的信息。
4.在左侧窗格中,选择第二个文本组件。然后,在右窗格的要包含在报告中的文本框中,输入:
The German artist Albrecht Durer (1471-1528)
created many woodcuts and prints with religious
and scientific symbolism. One of his most famous
works, Melancholia I, explores the depressed state
of mind that opposes inspiration and expression.
Renaissance astrologers believed that the Jupiter magic
square (shown in the upper right portion of the image)
could aid in the cure of melancholy. The engraving's
date (1514) can be found in the lower row of numbers
in the square.
添加图像
要创建阿尔布雷希特·丢勒的蚀刻画图像并将其包含在报告中,请使用 Figure Snapshot 组件:
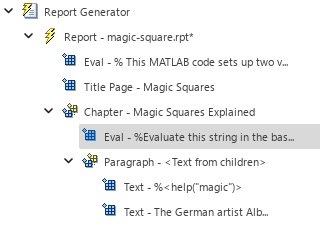
1.在左侧窗格中,选择章节组件。
2.在中间窗格的 MATLAB 部分,添加一个 Evaluate MATLAB Expression 组件。在左侧窗格中,Eval 组件作为 Chapter 组件的子组件,位于 Paragraph 组件上方。
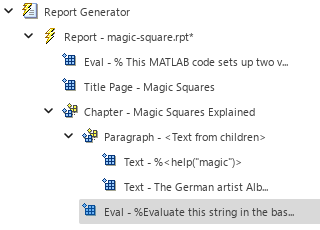
3.在工具栏上,使用“向下移动”按钮 ![]() 将 Eval 组件移动到段落组件下方,位于两个文本组件之后。
将 Eval 组件移动到段落组件下方,位于两个文本组件之后。
4.在右侧窗格中,为 Eval 组件指定以下属性:
清除在报告中插入 MATLAB 表达式和在报告中显示命令行窗口输出复选框。
在要在基础工作区中计算的表达式框中,输入此 MATLAB 代码,该代码将在 MATLAB 图窗中显示丢勒的蚀刻画:
% This MATLAB code loads a self-portrait of
% Albrecht Durer, a German artist. There is
% a magic square in the upper right corner
% of the image.

durerData=load("durer.mat","-mat");
figure(Units="Pixels",...
    Position=[200 200 size(durerData.X,2)*.5 size(durerData.X,1)*.5]);

image(durerData.X);
colormap(durerData.map);
axis("image");
set(gca,...
    Xtick=[], ...
    Ytick=[], ...
    Units="normal", ...
    Position=[0 0 1 1]);

clear durerData
在如果出现错误,请评估此表达式框中,输入以下代码,如果杜勒蚀刻画的图像无法加载,则会显示错误:
disp("Error during eval:"+evalException.message)
5.在中间窗格的 Handle Graphics 部分,添加一个图窗快照组件。然后,在右侧窗格中,指定以下属性:
将纸张方向设置为
Portrait。将背景颜色设置为
Light graphics theme。
6.在中间窗格的 MATLAB 部分,添加一个 Evaluate MATLAB Expression 组件。然后,在右侧窗格中,指定以下属性:
清除在报告中插入 MATLAB 表达式和在报告中显示命令行窗口输出复选框。
在在基础工作区中要评估的表达式框中,输入此 MATLAB 代码,该代码将删除 MATLAB 工作区中的当前图像:
% This command deletes the Durer image
delete(gcf);
在如果出现错误,请评估此表达式框中,输入以下代码,如果上一步的命令失败,则会显示错误:
disp("Error during eval:"+evalException.message)

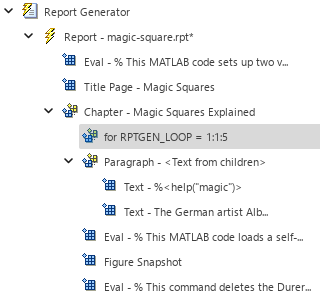
为每个幻方创建一个章节
要为报告添加一个章节,以包含由变量 magicSizeVector 指定的每个幻方,请使用 For Loop 组件:
1.在左侧窗格中,选择章节组件。
2.在中间窗格的逻辑和流控制部分,添加一个 For Loop 组件。在左侧窗格中,For Loop 组件作为 Chapter 组件的子组件,位于 Paragraph 组件上方。
3.在工具栏上,使用“向左移动”按钮 ![]() 将 For 组件移动到与 Chapter 组件同级的位置。
将 For 组件移动到与 Chapter 组件同级的位置。

4.在右侧窗格中,为 For 组件指定以下属性:
将 End 设置为
length(magicSizeVector)。该表达式计算包含幻方阵各种尺寸的向量长度。将变量名称设置为
MAGIC_SQUARE_INDEX。该变量充当循环索引。
5.在中间窗格的 MATLAB 部分,添加一个 Evaluate MATLAB Expression 组件。然后,在右侧窗格中,指定以下属性:
清除在报告中插入 MATLAB 表达式和在报告中显示命令行窗口输出复选框。
在在基础工作区中要评估的表达式框中,输入以下 MATLAB 代码,该代码将幻方阵的下一个尺寸保存为变量
magic_Square_Size:
Magic_Square_Size = magicSizeVector(MAGIC_SQUARE_INDEX);
在如果出现错误,请评估此表达式框中,输入以下代码,如果上一步的命令失败,则会显示错误:
disp("Error during eval:"+evalException.message)
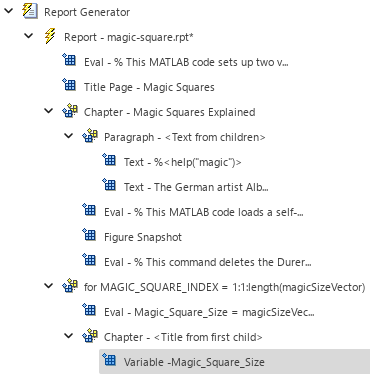
6.在中间窗格的格式部分,添加一个章节/小节组件。然后,在右侧窗格中,对于标题,选择 Automatic。
7.在中间窗格的 MATLAB 部分,将插入变量组件添加到报告中。然后,在右侧窗格中,指定以下属性:
将变量名设置为
Magic_Square_Size。将 显示为 设置为
Inline text。
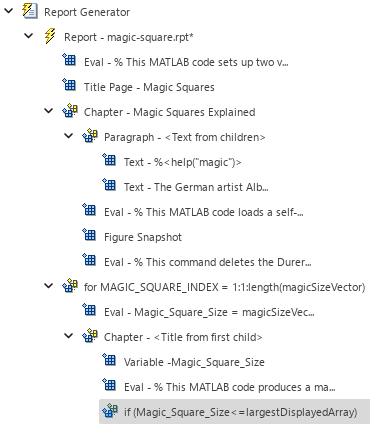
显示每个幻方
报告以彩色图像显示小幻方数组和大方阵。要确定使用哪种方法,请添加 Logical If、Logical Then 和 Logical Else 组件:
1.在左侧窗格中,选择变量组件。
2.在中间窗格的 MATLAB 部分,添加一个 Evaluate MATLAB Expression 组件。然后,在右侧窗格中,指定以下属性:
清除在报告中插入 MATLAB 表达式和在报告中显示命令行窗口输出复选框。
在要在基础工作区中计算的表达式框中,输入此代码 MATLAB,该代码将创建一个大小为
Magic_Square_Size的幻方矩阵mySquare,并在 MATLAB 图窗中打开该矩阵的图像:
% This MATLAB code produces a magic
% square of size Magic_Square_Size
% and creates an image of that square.

mySquare=magic(Magic_Square_Size);
clf
imagesc(mySquare);
title(sprintf("Magic Square N=%i",Magic_Square_Size))
set(gca,Ydir="normal");
axis equal;
axis tight;
在如果出现错误,请评估此表达式框中,输入以下代码,如果上一步的命令失败,则会显示错误:
disp("Error during eval:"+evalException.message)
3.在中间窗格的逻辑和流程控制部分,添加一个逻辑 If 组件,以确定是将幻方显示为数值数组还是图像。然后,在右侧窗格中,将测试表达式设置为
Magic_Square_Size<=largestDisplayedArray
4.在中间窗格的逻辑和流控制部分,添加一个逻辑 Else 组件。
5.在左侧窗格中,再次选择 if 组件。然后,在中间窗格的逻辑和流控制部分,添加一个逻辑 Then 组件。在左侧窗格中,then 组件出现在 else 组件上方。
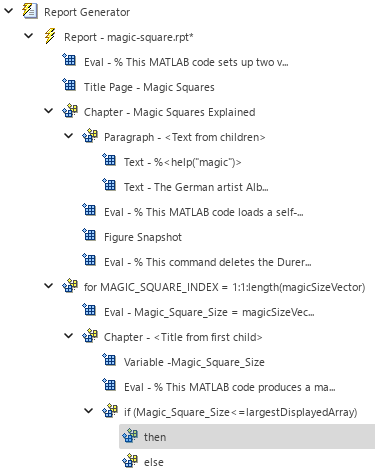
6.在左侧窗格中,选择 then 组件。
7.在中间窗格的 MATLAB 部分,添加一个插入变量组件。然后,在右侧窗格中,指定以下属性:
将变量名 Variable name 设置为
mySquare,该变量用于存储幻方阵。将标题设置为
None。将数组大小限制设置为
0。
8.在左侧窗格中,选择 else 组件。
9.在中间窗格的 Handle Graphics 部分,添加一个图窗循环组件和一个图窗快照组件。然后,在右侧窗格中,指定以下属性:
将纸张方向设置为
Portrait。将图像大小设置为
Custom。然后,在图像大小下方的框中,输入自定义图像大小为[5 4]。将背景颜色设置为
Light graphics theme。
10.保存报告。
生成报告
要生成报告,在工具栏上点击报告按钮 ![]() 。报告生成以下内容:
。报告生成以下内容:
报告资源管理器左侧窗格突出显示报告设置文件执行的每个组件。
消息列表窗口显示报告生成的进度。要指定“消息列表”窗口要显示的详细程度,请使用窗口顶部的下拉列表。
处理完成后,MATLAB 网页浏览器将打开并显示 HTML 文件。