通过编程更新演示内容
您可以使用 PPT API 以编程方式更新现有 PowerPoint® 演示文稿中的内容。
生成现有演示文稿
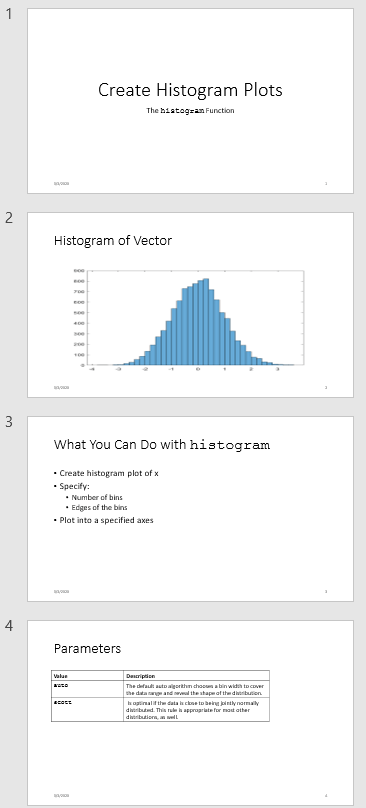
此示例更新 PowerPoint 演示文稿 myPresentation 中的内容。要生成演示文稿,请运行 通过编程创建演示文稿 中的示例。尽管您以编程方式创建了演示文稿,但在生成之后,该演示文稿就像任何其他 PowerPoint 演示文稿一样。演示文稿包括四张幻灯片:
标题幻灯片,标题为
Create Histogram Plots矢量直方图
标题为
What You Can Do with histogram的幻灯片直方图函数参数
要使用 PPT API 以编程方式更新现有 PowerPoint 演示文稿中的内容,您需要:
通过命名您想要替换的内容对象来设置 PowerPoint 演示文稿。如果您想添加新内容,请在演示文稿中插入该内容的占位符。
在 MATLAB® 中,导入
mlreportgen.pptPPT API 命名空间。创建一个使用现有演示文稿作为更新版本的模板的
Presentation对象。替换您想要更新的任何现有幻灯片内容。
添加幻灯片任何新幻灯片。
生成演示文稿。
演示文稿更新
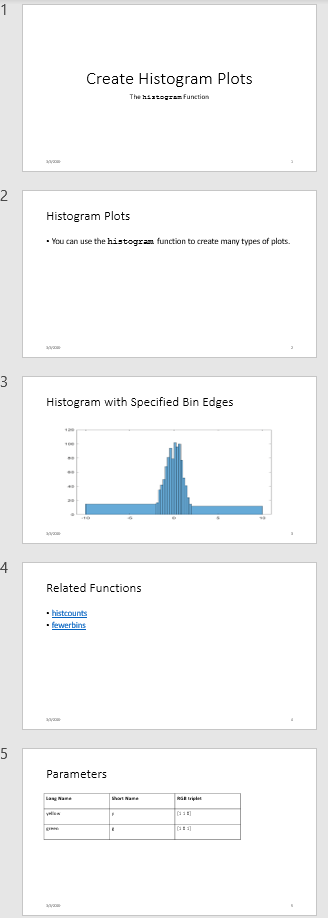
在此示例中,您使用 PPT API 对 myPresentation 演示文稿进行以下更改:
替换第二张幻灯片上的图片。
替换第三张幻灯片上的文字。
替换第四张幻灯片上的表。
在包含情节的幻灯片之前插入一张新幻灯片。
以下是更新后的演示文稿:
设置现有演示文稿
PPT API 程序使用 PowerPoint 模板生成演示文稿。当您以编程方式更新现有的 PowerPoint 演示文稿时,请使用该演示文稿作为更新演示文稿的模板。要更新 Slide 对象中的内容,请使用 PPT API。
打开
myPresentation演示文稿。在 PowerPoint 中,点击视图 > 普通。查看幻灯片中内容对象的名称。在主页选项卡中,点击选择 > 选择窗格。当您点击幻灯片中的内容时,所选内容窗格会突出显示内容对象的名称。
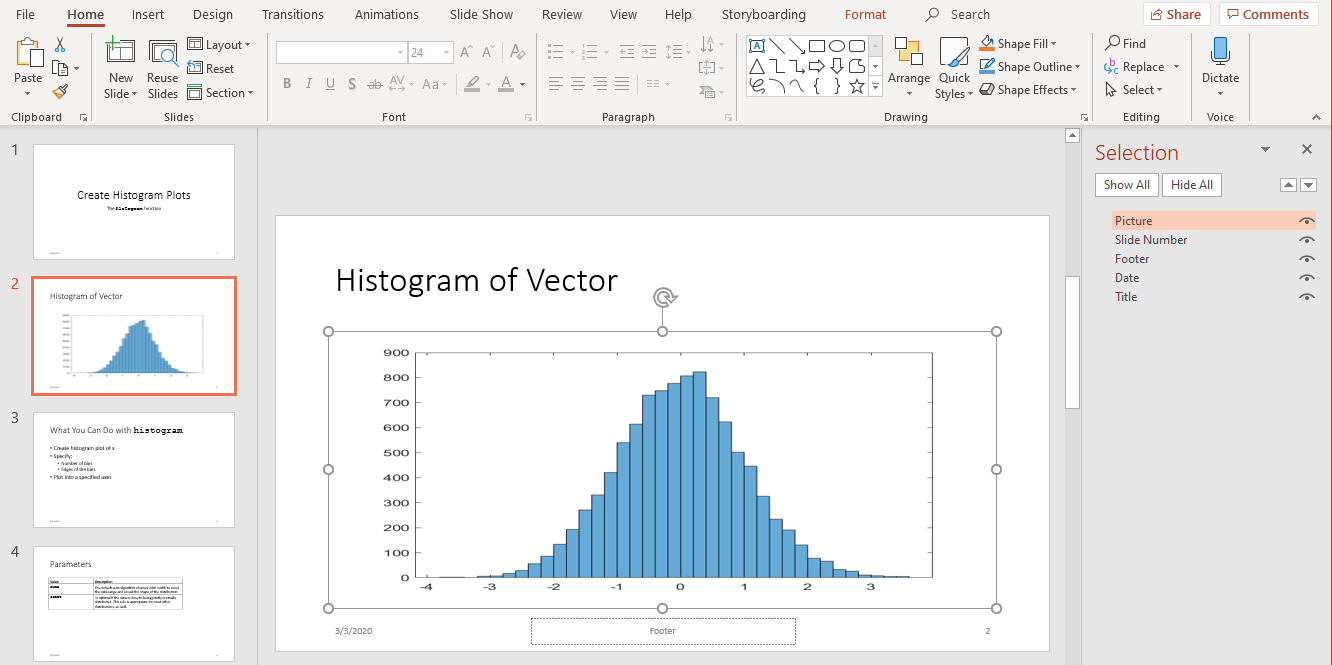
重命名内容对象。在 PowerPoint 所选内容窗格中,点击内容名称框并将当前名称替换为您想要的名称。使用这些唯一的名称来更新内容对象。
在第二张幻灯片中,将
Title对象名称更改为Histogram,将Picture对象名称更改为HistBins。在第三张幻灯片中,将
Title更改为RelatedFuncs。将Content更改为FuncList。在第四张幻灯片中,将
Table更改为ParamTable。
导入 PPT API 命名空间
所有 PPT API 类名都包含前缀 mlreportgen.ppt。为了避免在代码中包含前缀,请在 PPT API 程序的开头插入此语句。
import mlreportgen.ppt.*注意
import 行是示例程序中的第一行。此示例分段创建 PPT API 程序,因此不显示 import 命令。要查看完整的程序,请点击 myUpdatedPresentation program。
创建 Presentation 对象
创建一个 Presentation 对象。指定:
myUpdatedPresentation.pptx作为生成的演示文稿的输出文件。myPresentation.pptx作为 PowerPoint 模板。使用您想要更新的演示文稿文件作为模板文件。
ppt = Presentation("myUpdatedPresentation.pptx","myPresentation.pptx");
open(ppt);
为输出文件指定不同的名称可保留原始内容。如果要覆盖现有的演示文稿,可以使用模板文件名作为输出文件的文件名。
替换图片
更改第二张幻灯片的标题。创建一个 Picture 对象来替换现有的图片。您可以将 find 方法与 Presentation 对象结合使用来查找名为 HistBins 和 Histogram(使用 PowerPoint 指定的唯一名称)的内容对象。
histTitle = Paragraph("Histogram with Specified Bin Edges");
replace(ppt,"Histogram",histTitle);

x = randn(1000,1);
edges = [-10 -2:0.25:2 10];
h = histogram(x,edges);
saveas(gcf,"hist_plot.png");

plotEdges = Picture("hist_plot.png");

replace(ppt,"HistBins",plotEdges);
用链接替换文本
更改第三张幻灯片的标题。创建文本来替换现有文本。文本包含指向 MathWorks® 在线文档的链接。将 ExternalLink 对象追加到 Paragraph 对象,并使用 Paragraph 对象元胞数组替换幻灯片内容。
funcsTitle = Paragraph("Related Functions");
replace(ppt,"RelatedFuncs",funcsTitle);

histCounts = Paragraph();
histCountsLink = ExternalLink...
("https://www.mathworks.com/help/matlab/ref/histcounts.html","histcounts");
append(histCounts,histCountsLink);

fewerbins = Paragraph();
fewerbinsLink = ExternalLink...
("https://www.mathworks.com/help/matlab/ref/matlab.graphics.chart.primitive.histogram.fewerbins.html","fewerbins");
append(fewerbins,fewerbinsLink);

replace(ppt,"FuncList",{histCounts,fewerbins});
替换表
要创建表,请创建一个 Table 对象。在 Table 构造函数中,您可以为表单元格指定一个值元胞数组。要获得顶行的粗体文本,请将 Paragraph 对象作为元胞数组的前三个元素。然后更换表。
long = Paragraph("Long Name");
long.Bold = true;
short = Paragraph("Short Name");
short.Bold = true;
rgb = Paragraph("RGB triplet");
rgb.Bold = true;

table2 = Table({long,short,rgb;"yellow","y","[1 1 0]";"green","g","[1 0 1] "});

contents = find(ppt,"ParamTable");
replace(ppt,"ParamTable",table2);
插入新幻灯片
您可以使用 PPT API 在现有演示文稿中插入新幻灯片,并可以指定幻灯片的数字位置。例如,此代码将新幻灯片设为演示文稿的第五张幻灯片。
newSlide = add(ppt,"Title and Content",5);但是,为了使幻灯片位于特定幻灯片之前,即使您稍后添加或删除其他幻灯片,您也可以指定参考幻灯片。要在更新现有的 PowerPoint 演示文稿时使用此方法,请使用 PPT API 命名参考幻灯片。插入新幻灯片时使用参考幻灯片的名称。
ppt.Children(2).Name = "ReferenceSlide";

refSlide = find(ppt,"ReferenceSlide");
introSlide = add(ppt,"Title and Content",refSlide);

contents = find(introSlide,"Title");
replace(contents(1),"Histogram Plots");

introText = Paragraph("You can use the ");
code = Text("histogram");
code.Font = "Courier New";
append(introText,code);
append(introText,"  function to create many types of plots.");

contents = find(introSlide,"Content");
replace(contents(1),introText);
生成并查看演示文稿
生成 PowerPoint 演示文稿。将 close 方法与 Presentation 对象一起使用。查看演示文稿。
close(ppt);
rptview(ppt);
myUpdatedPresentation 的代码
这是用于创建 myUpdatedPresentation 演示文稿的完整 PPT API 程序。
注意
此代码要求 myPresentation.pptx 文件位于您当前的文件夹中。要生成该演示文稿,请运行 通过编程创建演示文稿 中的示例。在运行 myUpdatedPresentation 的代码之前,请确保现有演示文稿包含 设置现有演示文稿 中描述的更改。
import mlreportgen.ppt.*;

ppt = Presentation("myUpdatedPresentation.pptx","myPresentation.pptx");
open(ppt);

histTitle = Paragraph("Histogram with Specified Bin Edges");
replace(ppt,"Histogram",histTitle);

x = randn(1000,1);
edges = [-10 -2:0.25:2 10];
h = histogram(x,edges);
saveas(gcf,"hist_plot.png");

plotEdges = Picture("hist_plot.png");

replace(ppt,"HistBins",plotEdges)

funcsTitle = Paragraph("Related Functions");
replace(ppt,"RelatedFuncs",funcsTitle);

histCounts = Paragraph();
histCountsLink = ExternalLink...
("https://www.mathworks.com/help/matlab/ref/histcounts.html","histcounts");
append(histCounts,histCountsLink);

fewerbins = Paragraph();
fewerbinsLink = ExternalLink...
("https://www.mathworks.com/help/matlab/ref/matlab.graphics.chart.primitive.histogram.fewerbins.html","fewerbins");
append(fewerbins,fewerbinsLink);

replace(ppt,"FuncList",{histCounts,fewerbins});

long = Paragraph("Long Name");
long.Bold = true;
short = Paragraph("Short Name");
short.Bold = true;
rgb = Paragraph("RGB triplet");
rgb.Bold = true;

table2 = Table({long,short,rgb;"yellow","y","[1 1 0]"; "green", "g","[1 0 1] "});

contents = find(ppt,"ParamTable");
replace(ppt,"ParamTable",table2);


ppt.Children(2).Name = "ReferenceSlide";

refSlide = find(ppt,"ReferenceSlide");
introSlide = add(ppt,"Title and Content",refSlide(1));

contents = find(introSlide,"Title");
replace(contents(1),"Histogram Plots");

introText = Paragraph("You can use the ");
code = Text("histogram ");
code.Style = {FontFamily("Courier New")};
append(introText,code);
append(introText,"function to create many types of plots.");

contents = find(introSlide,"Content");
replace(contents(1),introText);

close(ppt);
rptview(ppt);