窗设计器
设计和分析频谱窗
说明
窗设计器使您能够设计和分析频谱窗。使用此 App,您可以:
显示一个或多个窗的时域和频域表示。
研究窗的行为如何随其长度和其他参数的变化而变化。
以图形方式设计窗并将其导出到 MATLAB® 工作区。

打开 窗设计器 App
MATLAB 工具条:在 App 选项卡的信号处理和音频下,点击 App 图标。
MATLAB 命令提示符:输入
windowDesigner。
示例
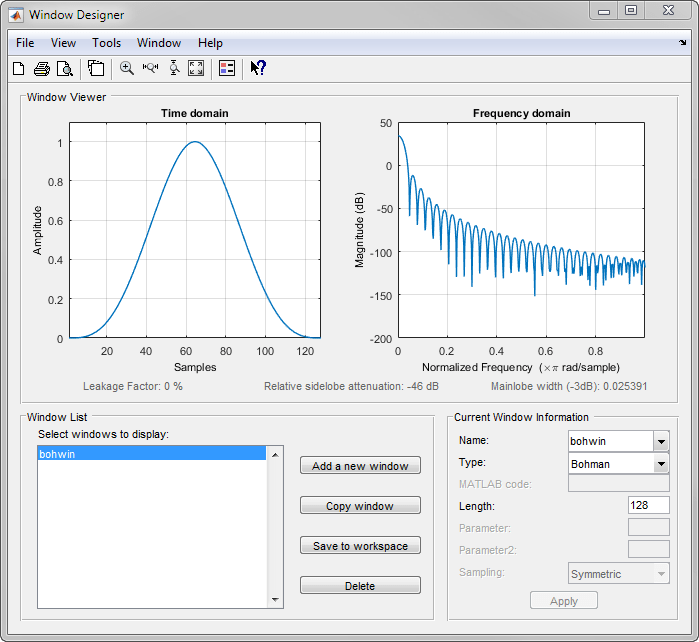
使用窗设计器指定长度为 128 的 Bohman 窗并将其导出到工作区。
创建一个 Bohman 窗。
从类型列表中,选择 Bohman。
在长度下,输入
128。在名称下,输入
bohwin。
点击应用。窗查看器框在时域和频域中显示该窗。
点击保存到工作区。在命令行中,您会看到以下消息:
bohwin has been exported to the workspace.
验证新窗是否存在于工作区中。
whos bohwinName Size Bytes Class Attributes bohwin 128x1 1024 double
使用窗设计器查看凯塞窗的行为如何取决于窗长度和形状参数 β。
创建一个凯塞窗。
从类型列表中,选择凯塞。
在长度下,输入
20。在 Beta 下,输入
0。在名称下,输入
kaiser0。
点击应用。窗查看器框在时域和频域中显示该窗。
点击添加新窗。创建一个长度为
20、Beta 等于3的凯塞窗。将该窗命名为kaiser3并点击应用。点击复制窗以创建第三个凯塞窗
kaiser6,其 Beta 等于6。点击应用。在窗列表下选择这三个窗。
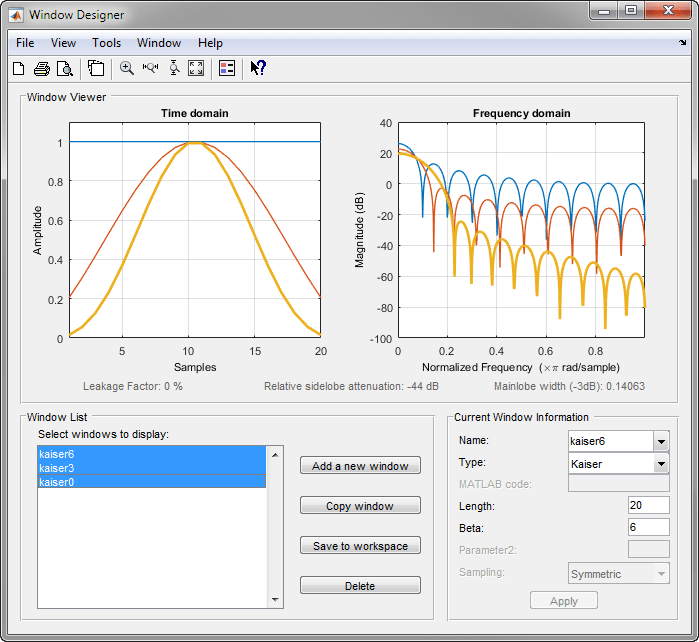
从名称列表中选择
kaiser0以在窗查看器绘图中突出显示它。将长度设置为10,将 Beta 设置为6。点击应用。从名称列表中选择
kaiser3。将长度保持设置为20,将 Beta 设置为6。点击应用。从名称列表中选择
kaiser6。将 Beta 保持设置为6,将长度设置为40。点击应用。从名称列表中选择
kaiser3。点击启用图例按钮 。
。
使用窗设计器可视化默认包含 64 个采样的汉明窗的旁瓣。
在视图菜单中,清除时域并点击分析参数。
在对话框中,指定以下参数:
在点数下,输入
8192。将频率单位设置为
Hz。将采样频率设置为
500Hz。选择归一化幅值。
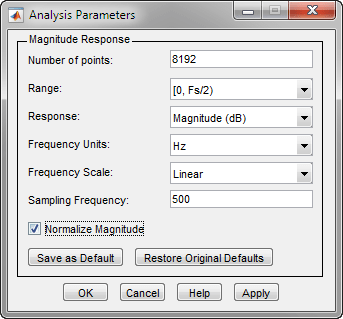
点击确定关闭对话框。点击缩放 X 轴按钮
 。放大 10 Hz 和 35 Hz 之间的区域,以详细查看窗的前两个旁瓣。
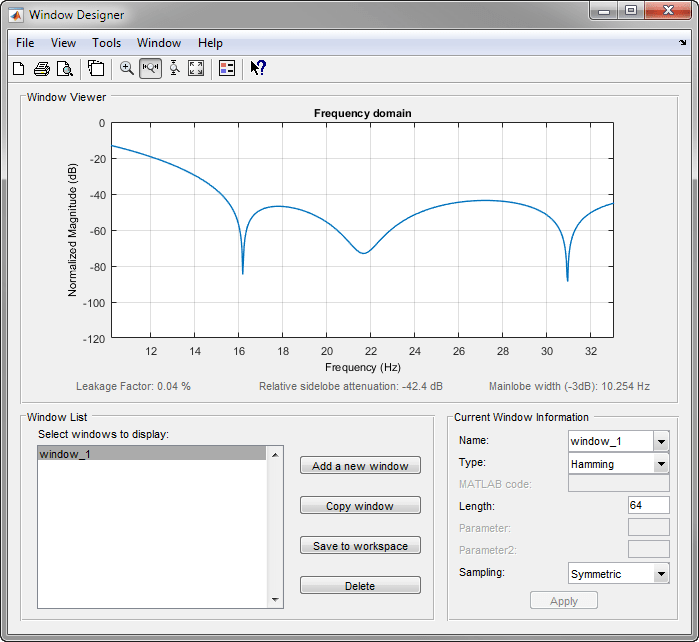
相关示例
版本历史记录
在 R2006a 之前推出