确定峰宽
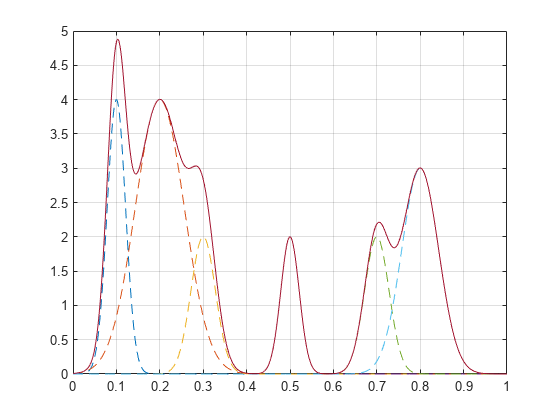
创建一个由几条高斯曲线之和组成的信号。指定每条曲线的位置、高度和宽度。
x = linspace(0,1,1000);

Pos = [1 2 3 5 7 8]'/10;
Hgt = [7 6 3 2 2 3]';
Wdt = [3 8 4 3 4 6]'/100;

y = sum(Hgt.*(exp(-((x-Pos)./Wdt).^2)),1);
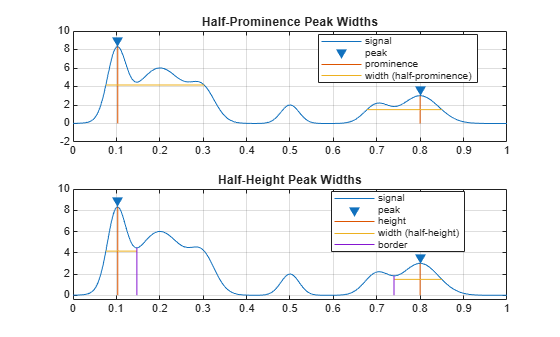
使用相对高差的一半处和半高处作为参考来测量峰宽。
tiledlayout("flow")
nexttile
findpeaks(y,x,Annotate="extents")
title("Half-Prominence Peak Widths")
nexttile
findpeaks(y,x,Annotate="extents",WidthReference="halfheight")
title("Half-Height Peak Widths")
选择在 x 轴上间隔至少 0.5 个单位的最高波峰。使用相对高差的一半处和半高处作为参考来测量峰宽。
figure
tiledlayout("flow")
nexttile
findpeaks(y,x,MinPeakDistance=0.5,Annotate="extents")
title("Half-Prominence Peak Widths")
nexttile
findpeaks(y,x,MinPeakDistance=0.5,Annotate="extents", ...
    WidthReference="halfheight")
title("Half-Height Peak Widths")
只有第一个和最后一个峰满足最小间距条件,因此图中显示的宽度对应于这两个峰。每个峰的范围保持不变,因此无论指定何种条件以及是否选中该峰,峰宽都保持其值不变。