在信号下采样中避免混叠
此示例说明如何在对信号进行下采样时避免混叠。如果离散时间信号的基带频谱支持不限于宽度为 弧度的区间,则以 为因子下采样会导致混叠。混叠是当信号频谱的多个副本重叠在一起时发生的失真。信号的基带频谱支持超出 弧度越多,混叠越严重。以下示例演示了以 2 为因子下采样的信号中的混叠。信号的基带频谱支持超过了 弧度的宽度。
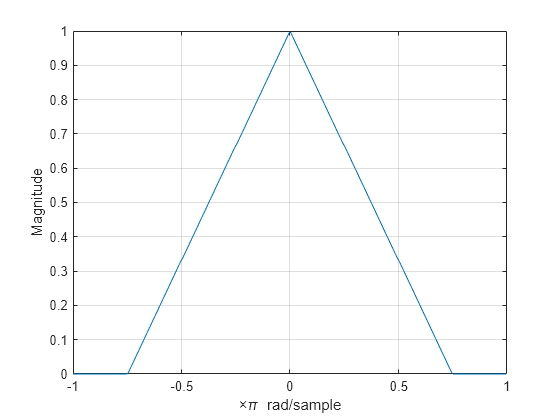
创建一个基带频谱支持等于 弧度的信号。使用 fir2 设计信号。绘制信号的频谱。信号的基带频谱支持超出 。
f = [0 0.2500 0.5000 0.7500 1.0000];
a = [1.00 0.6667 0.3333 0 0];

nf = 512;
b1 = fir2(nf-1,f,a);
Hx = fftshift(freqz(b1,1,nf,"whole"));

omega = -pi:2*pi/nf:pi-2*pi/nf;
plot(omega/pi,abs(Hx))
grid
xlabel("\times\pi rad/sample")
ylabel("Magnitude")
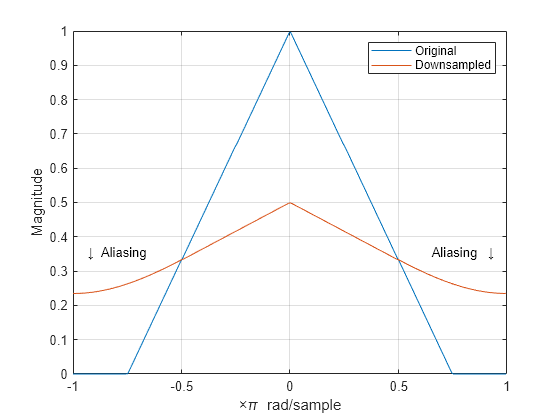
以 2 为因子对信号下采样,并绘制下采样信号的频谱和原始信号的频谱。除频谱的振幅缩放之外,重叠频谱副本的叠加还会导致 的原始频谱失真。
y = downsample(b1,2,0);
Hy = fftshift(freqz(y,1,nf,"whole"));

hold on
plot(omega/pi,abs(Hy))
hold off
legend("Original","Downsampled")
text(2.5/pi*[-1 1],0.35*[1 1], ...
    {"\downarrow Aliasing","Aliasing \downarrow"}, ...
    HorizontalAlignment="center")
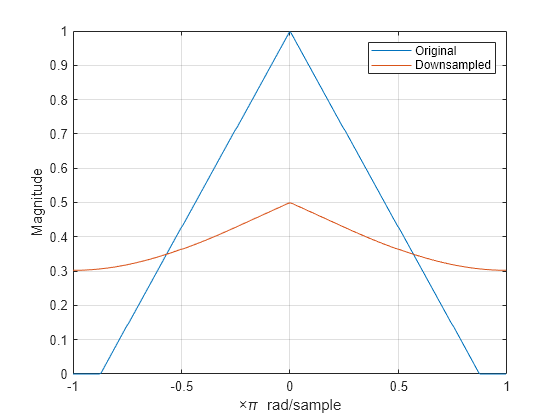
将信号的基带频谱支持增加到 并以 2 为因子对信号下采样。绘制原始频谱和下采样信号的频谱。频谱宽度的增加导致下采样信号频谱中更明显的混叠,因为有更多信号能量处在 之外。
f = [0 0.2500 0.5000 0.7500 7/8 1.0000];
a = [1.00 0.7143 0.4286 0.1429 0 0];

b2 = fir2(nf-1,f,a);
Hx = fftshift(freqz(b2,1,nf,"whole"));

plot(omega/pi,abs(Hx))
grid
xlabel("\times\pi rad/sample")
ylabel("Magnitude")

y = downsample(b2,2,0);
Hy = fftshift(freqz(y,1,nf,"whole"));

hold on
plot(omega/pi,abs(Hy))
hold off
legend("Original","Downsampled")
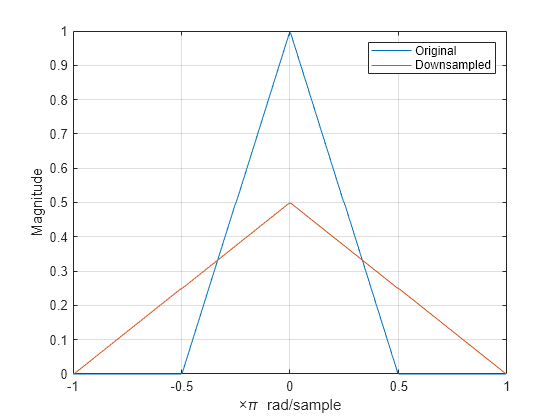
最后,构造基带频谱支持仅限于 的信号。以 2 为因子对信号下采样,并绘制原始信号的频谱和下采样信号的频谱。下采样信号是全频带信号。下采样信号的频谱是原始频谱的扩展和缩放版本,但频谱的形状得以保留,因为频谱副本不重叠。没有混叠。
f = [0 0.250 0.500 0.7500 1];
a = [1.0000 0.5000 0 0 0];

b3 = fir2(nf-1,f,a);
Hx = fftshift(freqz(b3,1,nf,"whole"));

plot(omega/pi,abs(Hx))
grid
xlabel("\times\pi rad/sample")
ylabel("Magnitude")

y = downsample(b3,2,0);
Hy = fftshift(freqz(y,1,nf,"whole"));

hold on
plot(omega/pi,abs(Hy))
hold off
legend("Original","Downsampled")
另请参阅
downsample | fir2 | freqz