Main Content

selectbyname

Select simulation data by name from SimData object

Description

example

[t,x,names] = selectbyname(simdata,selectNames) returns the simulation time points t, the simulation data x, and corresponding names for the states specified by selectNames.

example

sdOut = selectbyname(simdata,selectNames) returns the simulation results of the states specified by selectNames as a SimData object sdOut.

example

___ = selectbyname(simdata,selectNames,'Format',formatValue) returns the simulation data in the specified data format.

Examples

collapse all

Load the model of glucose-insulin response. For details about the model, see the Background section in Simulate the Glucose-Insulin Response.

sbioloadproject('insulindemo.sbproj','m1');

Suppress an information warning that is issued during simulations.

warnSettings = warning('off', 'SimBiology:DimAnalysisNotDone_MatlabFcn_Dimensionless');

Simulate a single meal for a normal subject for 7 hours.

singleMeal = sbioselect(m1,'Name','Single Meal');
cs = getconfigset(m1,'active');
cs.StopTime = 7;
sd = sbiosimulate(m1,singleMeal)
 
   SimBiology Simulation Data
 
   ModelName:        Cobelli's Glucose-Insulin System
   Logged Data:
     Species:        15
     Compartment:    0
     Parameter:      24
     Sensitivity:    0
     Observable:     0
 
sbioplot(sd);

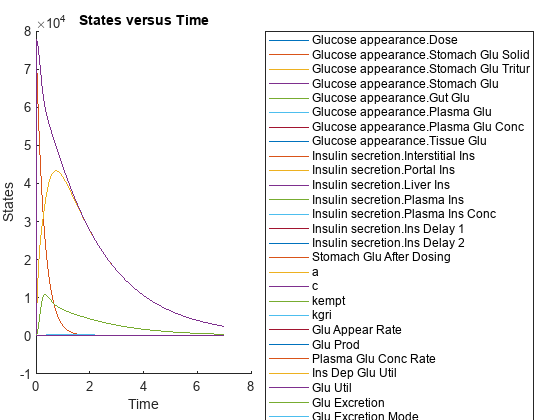
Select all species data logged in the SimData object sd.

[t,x,names] = select(sd,{'Type','species'});
names
names = 15x1 cell
    {'Glucose appearance.Dose'              }
    {'Glucose appearance.Stomach Glu Solid' }
    {'Glucose appearance.Stomach Glu Tritur'}
    {'Glucose appearance.Stomach Glu'       }
    {'Glucose appearance.Gut Glu'           }
    {'Glucose appearance.Plasma Glu'        }
    {'Glucose appearance.Plasma Glu Conc'   }
    {'Glucose appearance.Tissue Glu'        }
    {'Insulin secretion.Interstitial Ins'   }
    {'Insulin secretion.Portal Ins'         }
    {'Insulin secretion.Liver Ins'          }
    {'Insulin secretion.Plasma Ins'         }
    {'Insulin secretion.Plasma Ins Conc'    }
    {'Insulin secretion.Ins Delay 1'        }
    {'Insulin secretion.Ins Delay 2'        }

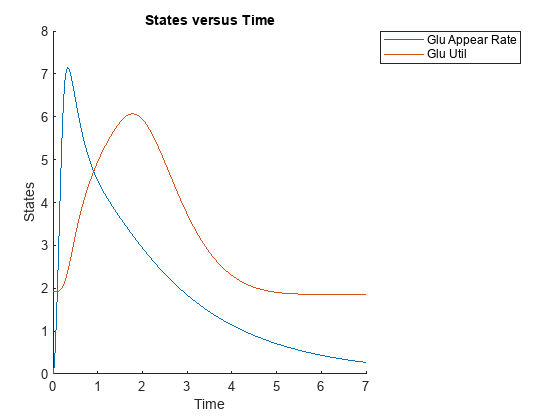
Plot data for the glucose rate of appearance and glucose utilization, namely Glu Appear Rate and Glu Util.

newsd = select(sd,{'Type','parameter','name',{'Glu Appear Rate'; 'Glu Util'}})
 
   SimBiology Simulation Data
 
   ModelName:        Cobelli's Glucose-Insulin System
   Logged Data:
     Species:        0
     Compartment:    0
     Parameter:      2
     Sensitivity:    0
     Observable:     0
 
sbioplot(newsd);

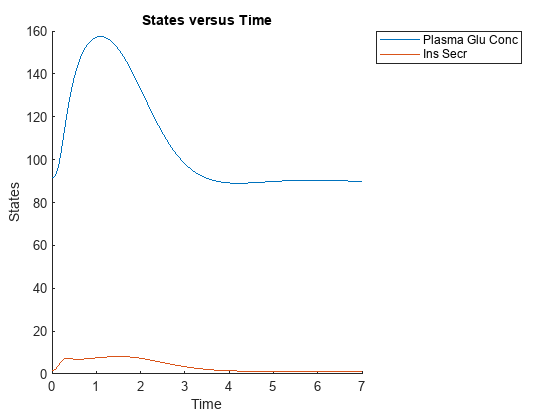
Compare data for the plasma glucose concentration (the species named Plasma Glu Conc) and insulin secretion rate (the parameter named Ins Secr). Use selectbyname to extract data by specifying the corresponding names.

newsd2 = selectbyname(sd,{'Plasma Glu Conc','Ins Secr'})
 
   SimBiology Simulation Data
 
   ModelName:        Cobelli's Glucose-Insulin System
   Logged Data:
     Species:        1
     Compartment:    0
     Parameter:      1
     Sensitivity:    0
     Observable:     0
 
sbioplot(newsd2);

Select data for all species and parameters that have Glu in their names.

newsd3 = select(sd,{'Where','Name','regexp','Glu'})
 
   SimBiology Simulation Data
 
   ModelName:        Cobelli's Glucose-Insulin System
   Logged Data:
     Species:        7
     Compartment:    0
     Parameter:      11
     Sensitivity:    0
     Observable:     0
 
newsd3.DataNames
ans = 18x1 cell
    {'Stomach Glu Solid'       }
    {'Stomach Glu Tritur'      }
    {'Stomach Glu'             }
    {'Gut Glu'                 }
    {'Plasma Glu'              }
    {'Plasma Glu Conc'         }
    {'Tissue Glu'              }
    {'Stomach Glu After Dosing'}
    {'Glu Appear Rate'         }
    {'Glu Prod'                }
    {'Plasma Glu Conc Rate'    }
    {'Ins Dep Glu Util'        }
    {'Glu Util'                }
    {'Glu Excretion'           }
    {'Glu Excretion Mode'      }
    {'Delayed Glu Signal'      }
    {'Delayed Glu Signal Mode' }
    {'Basal Glu Prod'          }

You can also return the selected data as a structure.

sdStruct = select(sd,{'Where','Name','regexp','Glu'},'Format','struct');

Restore the warning settings.

warning(warnSettings);

Input Arguments

collapse all

Simulation data, specified as a SimData object or array of SimData objects.

Names of states that you want to select data for, specified as a character vector, string, string vector, or cell array of character vectors.

Example: {'x1','x2','x3'}

Data Types: char | string | cell

Simulation data format, specified as a character vector or string. Some formats require you to specify only one output argument. The valid formats follow.

  • 'num' — This format returns simulation time points and simulation data in numeric arrays and the names of quantities and sensitivities as a cell array. This format is the default when you run getdata with multiple output arguments.

  • 'nummetadata' — This format returns a cell array of metadata structures instead of the names of quantities and sensitivities as the third output argument.

  • 'numqualnames' — This format returns qualified names in the third output argument to resolve ambiguities.

You must specify only one output argument for the following formats.

  • 'simdata' — This format returns data in a new SimData object or an array of SimData objects. This format is the default when you specify a single output argument.

  • 'struct' — This format returns a structure or structure array that contains both data and metadata.

  • 'ts' — This format returns data as a cell array.

    • If simdata is scalar, the cell array is an m-by-1 array, where each element is a timeseries object. m is the number of quantities and sensitivities logged during the simulation.

    • If simdata is not scalar, the cell array is k-by-1, where each element of the cell array is an m-by-1 cell array of timeseries objects. k is the size of simdata, and m is the number of quantities or sensitivities in each SimData object in simdata. In other words, the function returns an individual time series for each state or column and for each SimData object in simdata.

  • 'tslumped' — This format returns the data as a cell array of timeseries objects, combining data from each SimData object into a single time series.

Output Arguments

collapse all

Simulation time points, returned as a numeric vector or cell array. If simdata is scalar, t is an n-by-1 vector, where n is the number of time points. If simdata is an array of objects, t is a k-by-1 cell array, where k is the size of simdata.

Simulation data, returned as a numeric matrix or cell array. If simdata is scalar, x is an n-by-m matrix, where n is the number of time points and m is the number of quantities and sensitivities logged during the simulation. If simdata is an array of objects, x is a k-by-1 cell array, where k is the size of simdata.

Names of quantities and sensitivities logged during the simulation, returned as a cell array. If simdata is scalar, names is an m-by-1 cell array. If simdata is an array of objects, names is a k-by-1 cell array, where k is the size of simdata.

Simulation results, returned as a SimData object.

Version History

Introduced in R2007b

See Also

| |