Load Input Data for Basic Test Cases
You can develop tests for models to verify that key behaviors match expectations and requirements as you continue development. You can create a basic test case by creating an input signal to load into the model. The input signal defines input values for the system at specific times of interest. By logging simulation results, you can verify that signals of interest have the expected values at each point of interest.
Create Input Data
For a basic test case, you typically want to analyze as few points of interest as possible to verify your system behavior. To ensure that the simulation takes a time step at each point of interest, include discontinuities in the input data and use a block that supports zero-crossing detection to load the data. The From File, From Workspace, Signal Editor, and Playback blocks all support zero-crossing detection for input data when you simulate using a variable-step solver.
To create the input signal, create a vector of time values and a vector of signal values that define the time and input value for each point of interest. Include a duplicate time and signal value at each discontinuity in the data. The loading blocks detect zero crossings in the input signal by checking for duplicate time values in the input data.
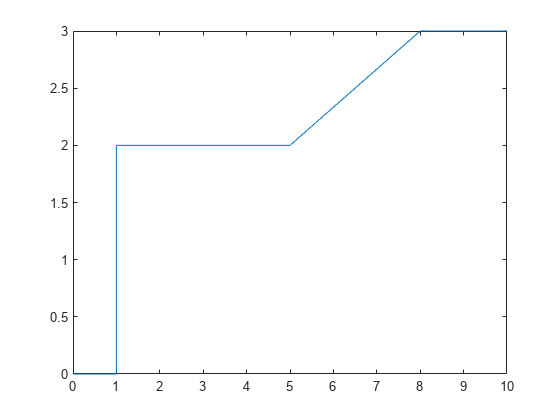
For this example, use these vectors of time and signal data to define the points of interest for the basic test case. The input data includes duplicate times to capture the discontinuities at times 1
, 5
, and 8
.
time = [0 1 1 5 5 8 8 10]'; vals = [0 0 2 2 2 3 3 3]';
These time and signal values define an input signal where:
The input value is
0
between times0
and1
.At time
1
, the input value jumps from0
to2
.Between times
1
and5
, the value remains2
.Between times
5
and8
, the signal value increases linearly to a final value of3
.The value remains
3
until time10
.
To visualize the signal, plot the data.
plot(time,vals)
To load the input data for the test case, you must use an input data format supported by the loading block you choose.
For this example, create a timetable
to load using the From Workspace block. To create a timetable
, the time data must be a duration
vector. Use the seconds
function to create a duration
vector with units of seconds.
time = seconds(time); simin = timetable(time,vals);
Open Example Model
Open the model FromWorkspaceTestCase
. The model contains a From Workspace block that loads the data in the variable simin
. The input data is conditioned using a Gain block, and the conditioned signal output from the Gain block is connected to an Outport block.
mdl = "FromWorkspaceTestCase";
open_system(mdl)
Configure Zero-Crossing Detection for Model and Block
To ensure the simulation takes a major time step at each point of interest, the model and block must be configured to detect zero crossings in the input data. The model FromWorkspaceTestCase
uses the default model and block parameter values and is already configured appropriately.
To check or configure zero-crossing detection for a model:
On the Modeling tab, under Setup, click Model Settings.
On the Solver tab, expand Solver details.
Set Zero-crossing control to
Use local settings
orEnable all
. When you chooseUse local settings
, you configure zero-crossing detection for each block. When you selectEnable all
, zero-crossing detection is enabled for all blocks that support zero-crossing detection, regardless of the block parameter value for each block.Click OK.
Alternatively, use the get_param
function or the set_param
function to check or set the parameter value.
get_param(mdl,"ZeroCrossControl")
ans = 'UseLocalSettings'
To check or configure zero-crossing detection for the From Workspace block:
Select the block in the model.
Open the Property Inspector by clicking the Property Inspector tab on the right of the Simulink Editor or by pressing Ctrl+Shift+I.
Select Enable zero-crossing detection.
Alternatively, use the get_param
function or the set_param
function to check or set the parameter value.
get_param(strcat(mdl,"/From Workspace"),"ZeroCross")
ans = 'on'
Run Test Case and Analyze Results
Simulate the model.
out = sim(mdl);
You can verify the model behavior at each point of interest by plotting the signal data or by analyzing logged output data.
The model in this example uses a Dashboard Scope to display the input signal and the conditioned output signal. By inspecting the signal values in the plot, you can see that the model correctly multiplies each input value by 2
at each point of interest.
See Also
From Workspace | Signal Editor | Playback | From File