Load Timetable Data Using Playback Block
This example shows how to add timetable data to a model using the Playback block, including how to selectively add multiple columns of interest from timetable data and reassign ports.
Open the model PlaybackRecord.slx, which contains an empty Playback block connected to a Record block. The Playback block loads external data into the model. The Record block logs output data from the Playback block. Use the Playback block to visualize data before loading it into the model. Use the Record block to visualize the logged signal data.
mdl = "PlaybackRecord";
open_system(mdl)
Add Timetable Data to Playback Block
Add timetable data to the Playback block to load the data to your model. You can load timetable data to the workspace first or add data to the Playback block directly from the file.
For this example, first load the timetable data to the workspace. The dTimeTableData.mat file contains timetable data for the air_fuel_ratio, ego, map, and speed signals in a model that represents a fuel control system for a gasoline engine. For more information about the model, see Model Fault-Tolerant Fuel Control System.
load("dTimeTableData.mat")
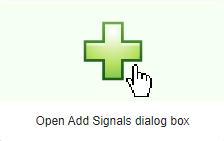
Double-click the Playback block, then open the Add Signals dialog box to add the timetable data to the block.
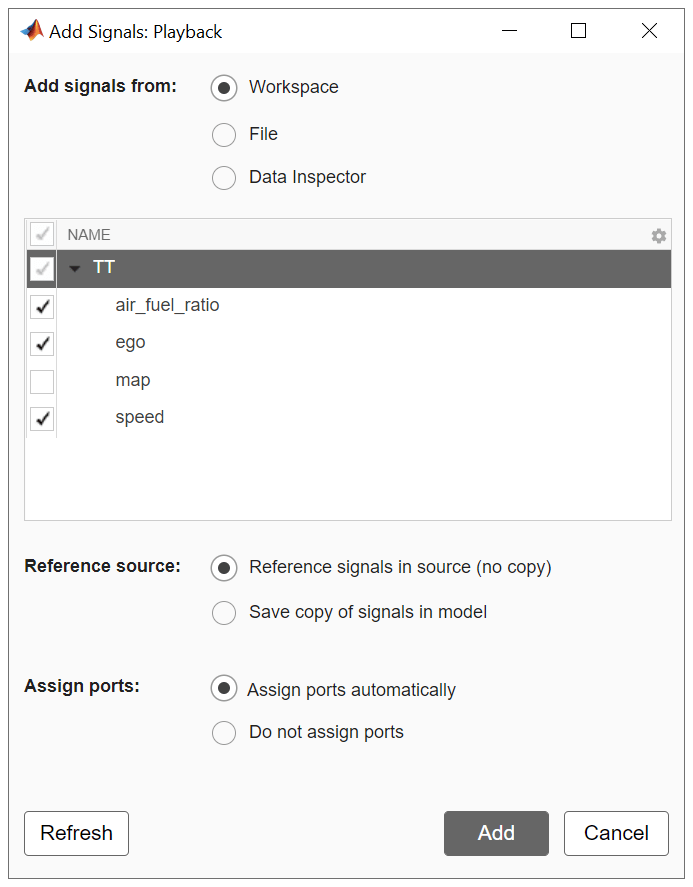
In the Add Signals dialog box, you can choose to add all the timetable data or select multiple columns of data to add to the block. For example, to add only the air_fuel_ratio, ego, and speed signals to the block:
Because you have already loaded the timetable data to the workspace, under Add signals from, select Workspace. If you did not want to load the data to the workspace, you can also add the timetable data to the Playback block directly from the file by selecting File and choosing the
dTimeTableData.matfile.Select the
air_fuel_ratio,ego, andspeedsignals from the variable namedTT.Under Reference source, select Reference signals in source (no copy). With this option selected, if the
TTvariable in the base workspace is updated with new values, the Playback block automatically gets the latest values.Under Assign ports, select Assign ports automatically.
Click Add.
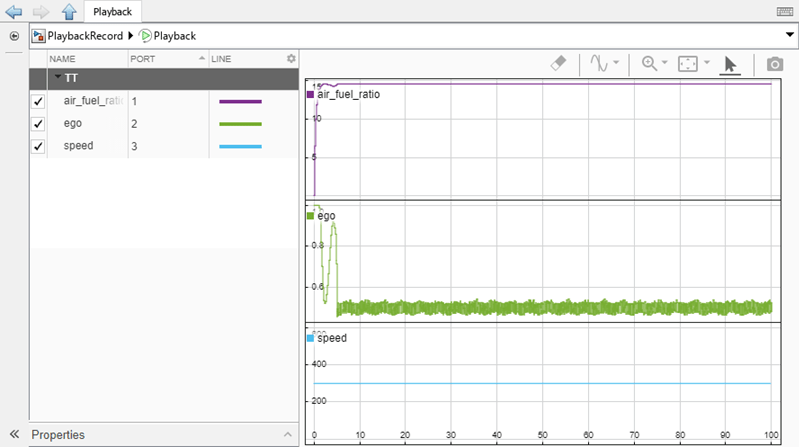
The Playback block plots the added signals in a sparkline plot so that you can visually inspect the data before loading signals into the model.
Reassign Ports
In this example, you chose to assign ports automatically. However, you can change the assignment of ports after data has been added to the Playback block. For example, you can switch the port assignments of the air_fuel_ratio and speed signals.
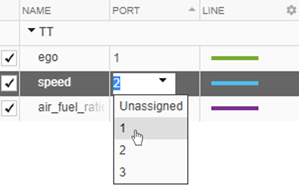
In the signal table, in the Port column for the
air_fuel_ratiosignal, select port3. The other two signals are shifted such that theegosignal is assigned to port1and thespeedsignal is assigned to port2.In the Port column for the
speedsignal, select port1.
You can also use port assignments to load a subset of data that has been added to the Playback block into your model. To not load data that has been added to the Playback block, unassign the signal from a port. For example, to not load the ego signal into the model:
In the signal table, in the Port column for the
egosignal, selectUnassigned.In the Unassign Port dialog box, click Delete Port.

The data for the ego signal remains added to the Playback block but is not loaded into the model. You can later load the data to the model by assigning the ego signal to a port.
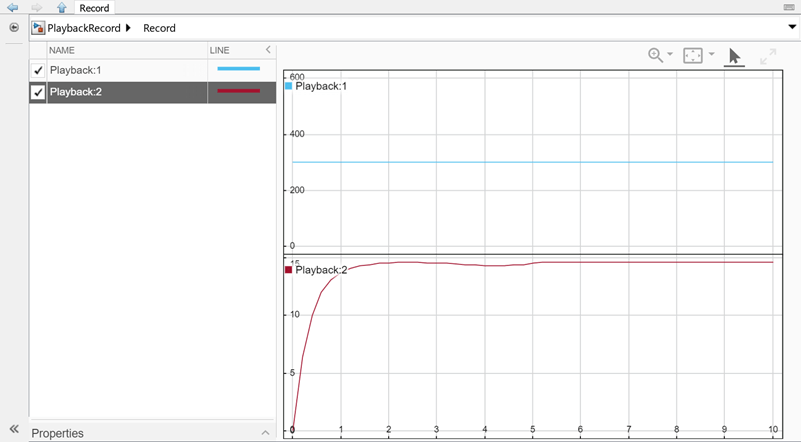
Visualize Output Using Record Block
The Playback block loads data into the model when you run a simulation. The outports of the Playback block reflect the port assignments. Connect the second port of the Playback block to the Record block. Then, simulate the model.
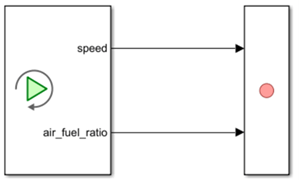
To visualize the logged signal data, double-click the record block.