Record
View and log data to the workspace, a file, or both
Libraries:
Simulink /
Sinks
Alternative Configurations of Record Block:
XY Graph
Description
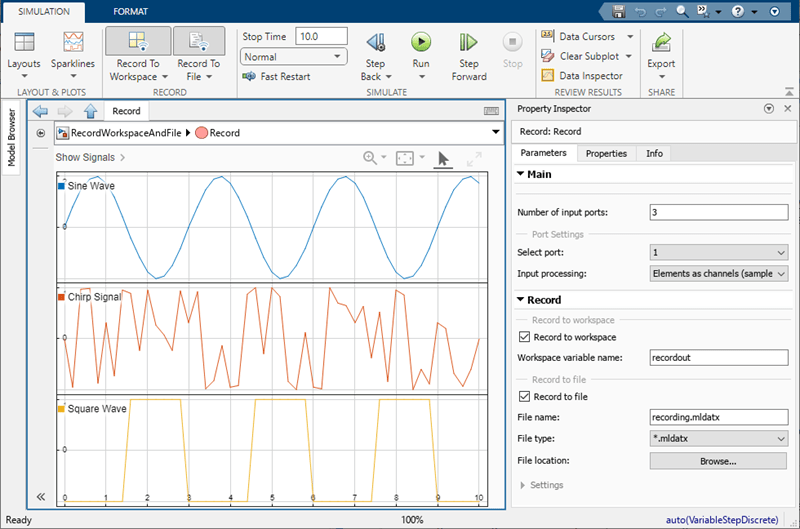
Use the Record block or the XY Graph block to record data to the workspace, a file, or to both the workspace and a file. When you log data to a file, you can choose to log to a MAT file, an MLDATX file, an Excel® file, or a Parquet file (since R2025a). Signals connected to a Record block always log to the Simulation Data Inspector. If you decide that you need to save data after simulation, you can export data from the Record block to the workspace or to any supported file type except a Parquet file.
You can also use the Record block to visualize connected signals. To view data for signals connected to the Record block, double-click the block. You have access to simulation controls, such as the Run button, while viewing data in the Record block.
By default, the Record block displays all connected signals on a sparklines plot. A sparkline is added for each connected signal. After sparklines fill the visible space, a scrollbar allows you to continue plotting signals.
Build Visualizations
The Record block supports most visualizations available in the Simulation Data Inspector. When a different visualization makes sense for your data, you can modify the plot layout and plot types using the Layouts option and the plot types selector, labeled Sparklines by default. Use the Layouts list to select a layout of subplots. To change the plot type of a subplot, select the subplot then select the desired plot type from the plot types selector.
For more information, see Log Data to the Workspace and a File Using the Record Block. For examples that show how to use each visualization type, see:
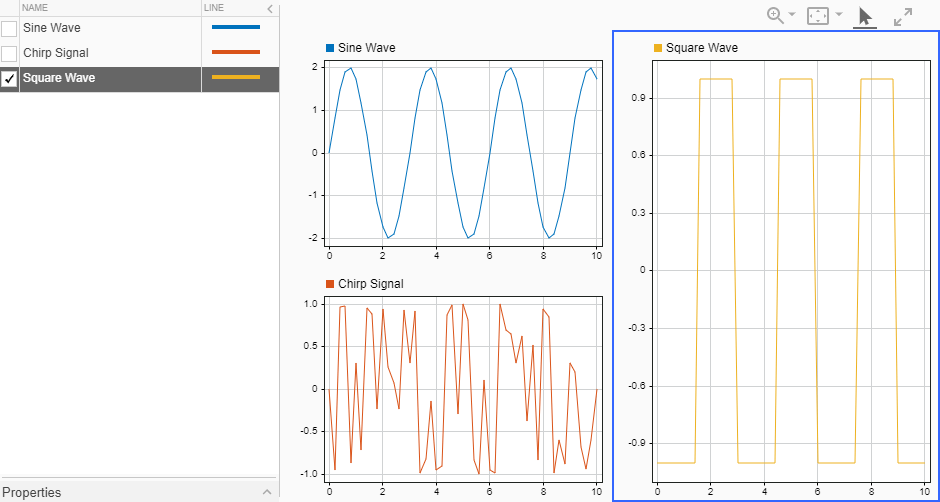
Sparklines — View Many Signals Together Using Sparklines
XY — Visualize Simulation Data on XY Plot and Analyze Data Using XY Plot
Map — View and Replay Map Data
Time plot and text editor — Create Plots Using the Simulation Data Inspector
Examples
Log Data to the Workspace and a File Using the Record Block
Use the Record block to log data to the workspace, to a file, or to both the workspace and a file.

Export Data to Parquet File Using Record Block
Use the Record block to export data to a Parquet file.
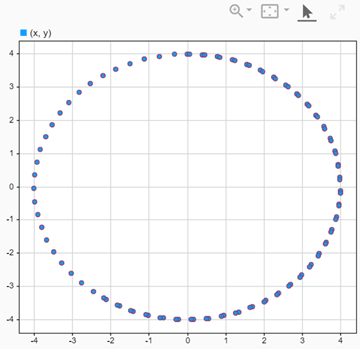
Plot a Circle Using the XY Graph Block
Plot x and y data for a circle using the XY Graph block.
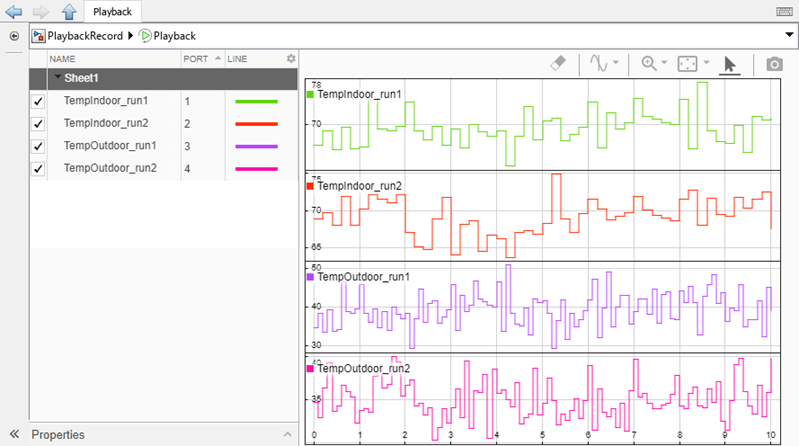
Load Data Using Playback Block
Load data from the workspace, a file, and the Simulation Data Inspector using the Playback block.
Limitations
The Record block does not support the array visualization available in the Simulation Data Inspector.
The Record block supports logging multidimensional signal data, including variable-size signals, but does not support visualizing multidimensional data. To visualize the data for a multidimensional signal using the Record block, convert the signal with multidimensional sample values to a set of signals, called channels, that each have scalar sample values. For more information, see Analyze Multidimensional Signal Data.
In R2025a: Live streaming is not supported for XY plots in external mode.
Ports
Input
Parameters
To edit block parameters interactively, use the Property Inspector. From the Simulink® Toolstrip, on the Simulation tab, in the Prepare gallery, select Property Inspector.
Main
Number of input ports, specified as an integer between 1 and
100, inclusive.
The XY Graph block is an alternative configuration of the Record block that visualizes data connected to two input ports on an XY plot. In the XY Graphblock, the first input port provides the x data, and the second input port provides the y data.
Programmatic Use
To set the block parameter value programmatically, use
the set_param function.
| Parameter: | NumPorts |
| Values: | 1 (default) | integer in the range [1, 100] |
| Data Types: | integer |
Example: set_param("myModel/Record","NumPorts",2)
Since R2025a
Specify a decimation factor to reduce the effective sample rate for the logged
data. For a decimation factor, n, the Record block
logs every nth sample value. For
example, when you specify the Decimation value as
2, the Record block logs every other data
point.
For more information about controlling which samples are logged during simulation, see Specify Signal Values to Log.
Programmatic Use
To set the block parameter value programmatically, use
the set_param function.
| Parameter: | Decimation |
| Values: | "1" (default) | positive integer in quotes |
| Data Types: | character vector | string |
Example: set_param("myModel/Record","Decimation","2")
Since R2025a
When you want to save or analyze only the data from the end of a simulation,
specify the number of samples you want to log as a positive integer greater than zero.
By default, the Record block logs data for the entire simulation, and
the value for the Limit data points to last parameter is
inf.
Limiting logged data to the last n signal values directly impacts memory allocation. When you specify this parameter, the software allocates memory upfront based on the specified value, not on the time steps generated during the simulation. For this reason, the Limit data points to last parameter is not recommended when logging an indeterminate number of time steps.
For more information about controlling which samples are logged during simulation, see Specify Signal Values to Log.
Programmatic Use
To set the block parameter value programmatically, use
the set_param function.
| Parameter: | MaxDataPoints |
| Values: | "inf" (default) | positive integer in quotes |
| Data Types: | character vector | string |
Example: set_param("myModel/Record","MaxDataPoints","20")
Use the Select port and Input processing parameters together to specify the input processing mode for a port. The input processing mode determines how the Record block interprets matrix data:
Sample-based — Each element in the matrix is a separate channel.
Frame-based — Each column in the matrix is a separate channel.
To use frame-based input processing, the signal must have a discrete sample rate, and the sample values must be nonscalar with fixed dimensions.
By default, each port processes the input signal as sample-based.
To change the input processing mode for a port:
Select the port number using the Select port parameter.
Select the input processing mode using the Input processing parameter.
Programmatic Use
To set the block parameter value programmatically, use
the set_param function.
Programmatically specify the input processing mode for each port by specifying
the FrameSettings parameter as a row vector with as many elements
as block ports. The element index corresponds to the port number on the block.
Specify 1 to use frame-based input processing for the port and
0 to use sample-based processing.
| Parameter: | FrameSettings |
| Values: | false (default) |
1-by-n row vector of logical values, where
n is equal to the number of ports |
| Data Types: | logical array |
Example: set_param("myModel/Record","FrameSettings",[true,false,true])
Use the Select port and Input processing parameters together to specify the input processing mode for a port. The input processing mode determines how the Record block interprets matrix data:
Sample-based — Each element in the matrix is a separate channel.
Frame-based — Each column in the matrix is a separate channel.
To use frame-based input processing, the signal must have a discrete sample rate, and the sample values must be nonscalar with fixed dimensions.
By default, each port processes the input signal as sample-based.
To change the input processing mode for a port:
Select the port number using the Select port parameter.
Select the input processing mode using the Input processing parameter.
Programmatic Use
To set the block parameter value programmatically, use
the set_param function.
Programmatically specify the input processing mode for each port by specifying
the FrameSettings parameter as a row vector with as many elements
as block ports. The element index corresponds to the port number on the block.
Specify 1 to use frame-based input processing for the port and
0 to use sample-based processing.
| Parameter: | FrameSettings |
| Values: | false (default) |
1-by-n row vector of logical values, where
n is equal to the number of ports |
| Data Types: | logical array |
Example: set_param("myModel/Record","FrameSettings"[true,false,true])
Inspect Signals
Since R2026a
This parameter is read-only.
Programmatically retrieve the unique signal IDs of all signals in the
Record block using the SignalIDs parameter with
get_param. When there is more than one signal in the
Record block, signal IDs are returned as a vector ordered by input
port number, matching the order that signals are listed in the signal table. With
these signal IDs, you can get descriptive statistics for a signal using the Simulink.analytics.getMetrics function. For example, get descriptive
statistics for the signal connected to the second input port of the
Record block in the model MyModel.
recSigIDs = get_param("MyModel/Record","SignalIDs");
sigStats = Simulink.analytics.getMetrics(recSigIDs(2))
sigStats =

  struct with fields:

           min: 0
           max: 16.7514
    peakToPeak: 16.7514
          mean: 8.1714
        median: 8.1521
           std: 5.0821
           rms: 9.5965
Alternatively, you can use the signal ID to extract the Simulink.sdi.Signal object, which you can then use for signal analysis,
such as calculating signal statistics, via the Signal object. For
example, get the maximum value of the first signal in the Record block.
To do so, first use the signal ID to obtain the Simulink.sdi.Signal
object for the signal. Then, use the max function on the
Signal object.
recSigIDs = get_param("myModel/Record","SignalIDs");
sigObj = Simulink.sdi.getSignal(recSigIDs(1));
maxVal = max(sigObj)
maxVal =

    6.0744
Programmatic Use
To get the block parameter value,
use the get_param function.
| Parameter: | SignalIDs |
| Values: | Read-only: positive integer | vector of positive integers |
Example: get_param(gcb,"SignalIDs")
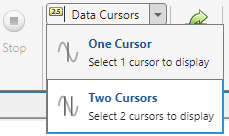
To inspect data displayed in the Record block using cursors, select the number of cursors to display from the Data Cursors list. You can use one or two cursors to inspect your data. For more information, see Inspect Simulation Data Using Cursors.
To change the position of a cursor, drag the cursor to the time point of interest. You can also set the position of the cursor by typing the desired time value into the label field at the bottom of the cursor.
Programmatic Use
To set the block parameter value programmatically, use the
set_param function. (since R2026a)
| Parameter: | ShowCursor |
| Values: | 0 | 1 | 2 |
Example: set_param(gcb,"ShowCursor",2)
In addition to setting the cursor position manually, you can also set the position
programmatically using the CursorPositions parameter with
set_param.
Programmatic Use
To set the block parameter value programmatically, use the
set_param function. (since R2026a)
| Parameter: | CursorPositions |
| Values: | nonnegative scalar | 1-by-2 vector of nonnegative scalars where the first element (left cursor) must be less than the second element (right cursor) |
Example: set_param(gcb,"CursorPositions",[2,8])
Record
Workspace logging option. By default, the Record block logs data
only to the Simulation Data Inspector. Select Record to workspace
to log data for signals connected to the Record block to the
MATLAB® workspace in a Simulink.SimulationData.Dataset
object.
Use the Workspace variable name parameter to specify the name
of the Dataset object that contains the logged Record
block data.
Tips
When you log data to the workspace, the way you access the data depends on your model configuration. By default, models provide all logged data in a single output variable as a
Simulink.SimulationOutputobject. You can access the Record block data using thegetfunction or a dot with the Record block workspace variable name. When the Single simulation output option is disabled, logging data appears in separate variables in the workspace, and you access the Record block data directly.Logging intervals specified using the Logging intervals configuration parameter apply to data logged to the workspace using the Record block.
Use a single Record block to log data to the Simulation Data Inspector, the workspace, and a file.
Programmatic Use
To set the block parameter value programmatically, use
the set_param function.
| Parameter: | RecordToWorkspace |
| Values: | "off" (default) | "on" | false or 0 | true or 1 |
Example: set_param("myModel/Record","RecordToWorkspace","on")
Name for the workspace variable that contains the logged block data.
Dependencies
To enable this parameter, select the Record to workspace parameter.
Programmatic Use
To set the block parameter value programmatically, use
the set_param function.
| Parameter: | VariableName |
| Values: | "recordout" (default) | valid MATLAB variable name |
| Data Types: | character vector | string |
Example: set_param("myModel/Record","VariableName","RecordedData")
Log to file option. By default, the Record block logs data to the Simulation Data Inspector only. Select Record to file to log data for signals connected to the Record block to a file.
Tips
Use the File name parameter to specify a name for the file.
Use the File type parameter to specify whether to log data to an MLDATX file, a MAT file, an Excel file, or a Parquet file (since R2025a).
Use the File location parameter to specify the path to the file.
Logging intervals specified using the Logging intervals configuration parameter do not apply to data logged to a file using the Record block.
Programmatic Use
To set the block parameter value programmatically, use
the set_param function.
| Parameter: | RecordToFile |
| Values: | "off" (default) | "on" | false or 0 | true or 1 |
Example: set_param("myModel/Record","RecordToFile","on")
Name of the file that contains the logged data. The name does not need to include the file extension. If you do include the file extension in the name, ensure the name uses a valid extension for the specified File type.
Tips
If you do not change the name or location of the file you log to from one run to the next, the Record block overwrites prior data in the file.
When you want to save the file in a location other than your working directory, use the File location parameter to specify the path to the directory where you want to save the file.
Dependencies
To enable this parameter, select the Record to file parameter.
Programmatic Use
To set the block parameter value programmatically, use
the set_param function.
Specify the File name, File type, and
File location parameters. Include the extension for the
desired file type in the name you pass to set_param. When you
want to save the file somewhere other than the current working directory, specify
the path with the filename and extension.
| Parameter: | FileName |
| Values: | "recording.mldatx" (default) | valid filename |
| Data Types: | character vector | string |
Example: set_param("myModel/Record","FileName","myRecording.mldatx")
Use the File type parameter to specify whether you want to log data to an MLDATX, MAT, Excel, or Parquet file (since R2025a).
Tips
When you log data to an Excel file, the data is formatted as described in Microsoft Excel Import, Export, and Logging Format.
When you log data to an Excel file, you can specify whether to share time columns using the Time parameter and which signal attributes to log using the Attributes parameter.
Dependencies
To enable this parameter, select Record to file.
Programmatic Use
To set the block parameter value programmatically, use
the set_param function.
Use the FileName parameter to specify the File
name, File type, and File
location parameters. Include the extension for the desired file type in
the name you pass to set_param. When you want to save the file
somewhere other than the current working directory, specify the path with the
filename and extension.
| Parameter: | FileName |
| Values: | "recording.mldatx" (default) | valid filename |
| Data Types: | character vector | string |
Example: set_param("myModel/Record","FileName","myRecording.parquet")
Use the File location parameter to specify the location where you want to save the file with the logged data when you want to save the file somewhere other than the working directory. Ensure you have write permissions in the directory you specify.
Dependencies
To enable this parameter, select Record to file.
Programmatic Use
To set the block parameter value programmatically, use
the set_param function.
Use the FileName parameter to specify the File
name, File type, and File
location parameters. Include the extension for the desired file type in
the name you pass to set_param. When you want to save the file
somewhere other than the current working directory, specify the path with the
filename and extension.
| Parameter: | FileName |
| Values: | "recording.mldatx" (default) | valid filename |
| Data Types: | character vector | string |
Example: set_param("myModel/Record","FileName","myRecording.mldatx")
Specify how to log signal time data when you log the Record block data to an Excel file or Parquet file (since R2025a).
Shared Time Columns— When time data is identical for multiple signals, the signals share a single time column in the logging file. The logging file can still include multiple time columns if the Record block logs data for signals with unique time data.Individual Time Columns— Each logged signal always has its own time column in the logging file.
Dependencies
To enable this parameter, select Record to file and specify
File type as *.xlsx or *.parquet (since R2025a).
Programmatic Use
To set the block parameter value programmatically, use
the set_param function.
Programmatically setting the Time parameter is supported only for Parquet files.
| Parameter: | SharedTimeColumn |
| Values: | "on" (default) | "off" |
Example: set_param("myModel/Record","SharedTimeColumn",
"off")
Select one or more signal attribute options to include in the logging file when you log data to an Excel file. Selected signal attributes appear in the signal column above the first data point according to the format described in Microsoft Excel Import, Export, and Logging Format.
Dependencies
To enable this parameter, select Record to file and specify
File type as *.xlsx.
Since R2025a
Specify compression as one of these options:
Fastest (snappy)— Similar save speed to an uncompressed file, smaller file sizeBalanced for Size and Speed (gzip)— Balance between file size and save speedCompact (brotli)— Smallest file size, slowest save speedNone (uncompressed)— Largest file size, fastest save speed
Dependencies
To enable this parameter, select Record to file and specify
File type as *.parquet.
Programmatic Use
To set the block parameter value programmatically, use
the set_param function.
| Parameter: | ParquetCompression |
| Values: | "fastest" (default) | "balanced" | "compact" | "none" |
Example: set_param("myModel/Record","ParquetCompression","balanced")
Since R2025a
Select this parameter to generate a JSON sidecar that contains all the logged metadata.
Dependencies
To enable this parameter, select Record to file and specify
File type as *.parquet.
Programmatic Use
To set the block parameter value programmatically, use
the set_param function.
| Parameter: | ParquetMetaData |
| Values: | "on" (default) | "off" |
Example: set_param("myModel/Record","ParquetMetaData","off")
Since R2025a
Specify row groups in the Parquet file.
Row Group Height— Specify the number of rows per group.Row Group Size (MB)— Specify the size of the row group in megabytes.
Dependencies
To enable this parameter, select Record to file and specify
File type as *.parquet.
Programmatic Use
To set the block parameter value programmatically, use
the set_param function.
| Parameter: | ParquetRowGroupPolicy |
| Values: | "height" (default) | "sizeinmb" |
Example: set_param("myModel/Record","ParquetRowGroupPolicy","sizeinmb")
Since R2025a
To specify the number of rows in each row group, set the Row Group
Policy parameter to Row Group Height. Then, use the
Row Group Policy Value parameter to define the number of rows
in each group, choosing a value between 1 and
67,108,864. By default, the value is auto,
which creates the largest possible row group without exceeding 512 MB.
To specify the size of each row group, set the Row Group
Policy parameter to Row Group Size (MB). Then, use
the Row Group Policy Value parameter to set the data size of
the row group in megabytes, up to 1GB.
Dependencies
To enable this parameter, select Record to file and specify
File type as *.parquet.
Programmatic Use
To set the block parameter value programmatically, use
the set_param function.
| Parameter: | ParquetRowGroupHeight |
| Values: | "auto" (default) | integer in the range [1, 67108864] in
quotes |
| Data Types: | character vector | string |
Example: set_param("myModel/Record","ParquetRowGroupPolicy","height","ParquetRowGroupHeight","5000")
| Parameter: | ParquetRowGroupSize |
| Values: | "512" (default) | positive number in the range (0,
1024] in quotes |
| Data Types: | character vector | string |
Example: set_param("myModel/Record","ParquetRowGroupPolicy","sizeinmb","ParquetRowGroupsize","450")
Block Characteristics
Data Types |
|
Direct Feedthrough |
|
Multidimensional Signals |
|
Variable-Size Signals |
|
Zero-Crossing Detection |
|
Alternative Configurations
Tips
To open the Record block in a new window, right-click the block, and then click Open In New Window
 .
.To open the Record block in a new tab, right-click the block, and then click Open In New Tab
 .
.
Extended Capabilities
Version History
Introduced in R2021aThe XY Graph block is replaced with a Record block that is preconfigured to display two input signals on an XY plot. Using the updated XY Graph block, you can:
View data on the XY plot during simulation.
Record the XY plot data to the workspace, a file, or the workspace and a file.
Zoom, pan, fit to view, and adjust the axis limits for the XY plot without having to simulate again.
Analyze the XY trace by using cursors and by adding a trend line.
Add additional ports and subplots to visualize additional simulation data alongside the XY plot on several visualization types, including time plots, maps, or additional XY plots.
Visualize multiple traces on the XY plot.
Upon simulation, the prior version of the XY Graph block opened a new
window to display the connected signal data during simulation. To view data on the updated
XY Graph block, double-click the block in the model. To view the XY plot in
a new window, right-click the block, and then click the Open In New Window button
![]() .
.
XY Graph blocks in existing models are automatically replaced with the new XY Graph block. XY Graph viewers are also replaced with the new XY Graph block. Goto and From blocks connect signals to the XY Graph block that replaces the XY Graph viewer.
Signals connected to an XY Graph block always stream to the Simulation Data Inspector.