View Many Signals Together Using Sparklines
This example shows how to use the sparklines visualization in the Simulation Data Inspector to easily plot and view many signals at once.
The sparklines visualization used in this example is also available in the Record block. When you use the sparklines plot in the Record block, you add the visualization and configure the appearance using the toolstrip. You plot data on the sparklines plot the same way shown in this example.
Simulate Model
This example plots signals logged from a simulation of the model sldemo_fuelsys.
Open the model.
mdl = "sldemo_fuelsys";
open_system(mdl);
To simulate the model, click Run. Then, under Review Results, click Data Inspector to open the Simulation Data Inspector.
Alternatively, simulate the model and open the Simulation Data Inspector programmatically.
out = sim(mdl);
Simulink.sdi.view
Plot Data on Sparklines Plot
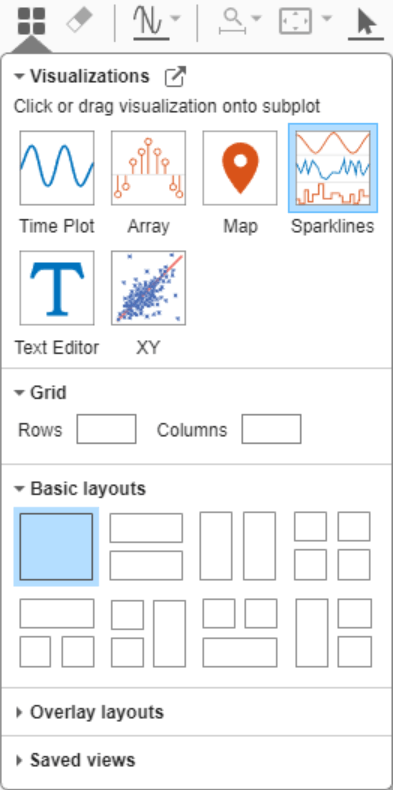
By default, the Simulation Data Inspector uses time plots for each subplot in the layout. To plot the data on a sparklines plot, add the visualization to the layout. Click Visualizations and layouts ![]() . From Visualizations, click or drag the Sparklines icon onto the subplot.
. From Visualizations, click or drag the Sparklines icon onto the subplot.
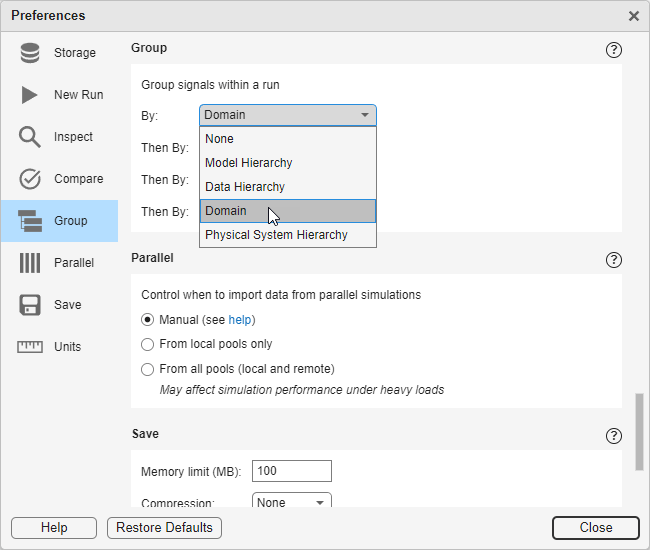
The Simulation Data Inspector can group logged data by domain, which indicates the type or source of the data. To group data by domain:
Click Preferences
 .
.In the Group pane, select
Domainfrom the drop-down list.
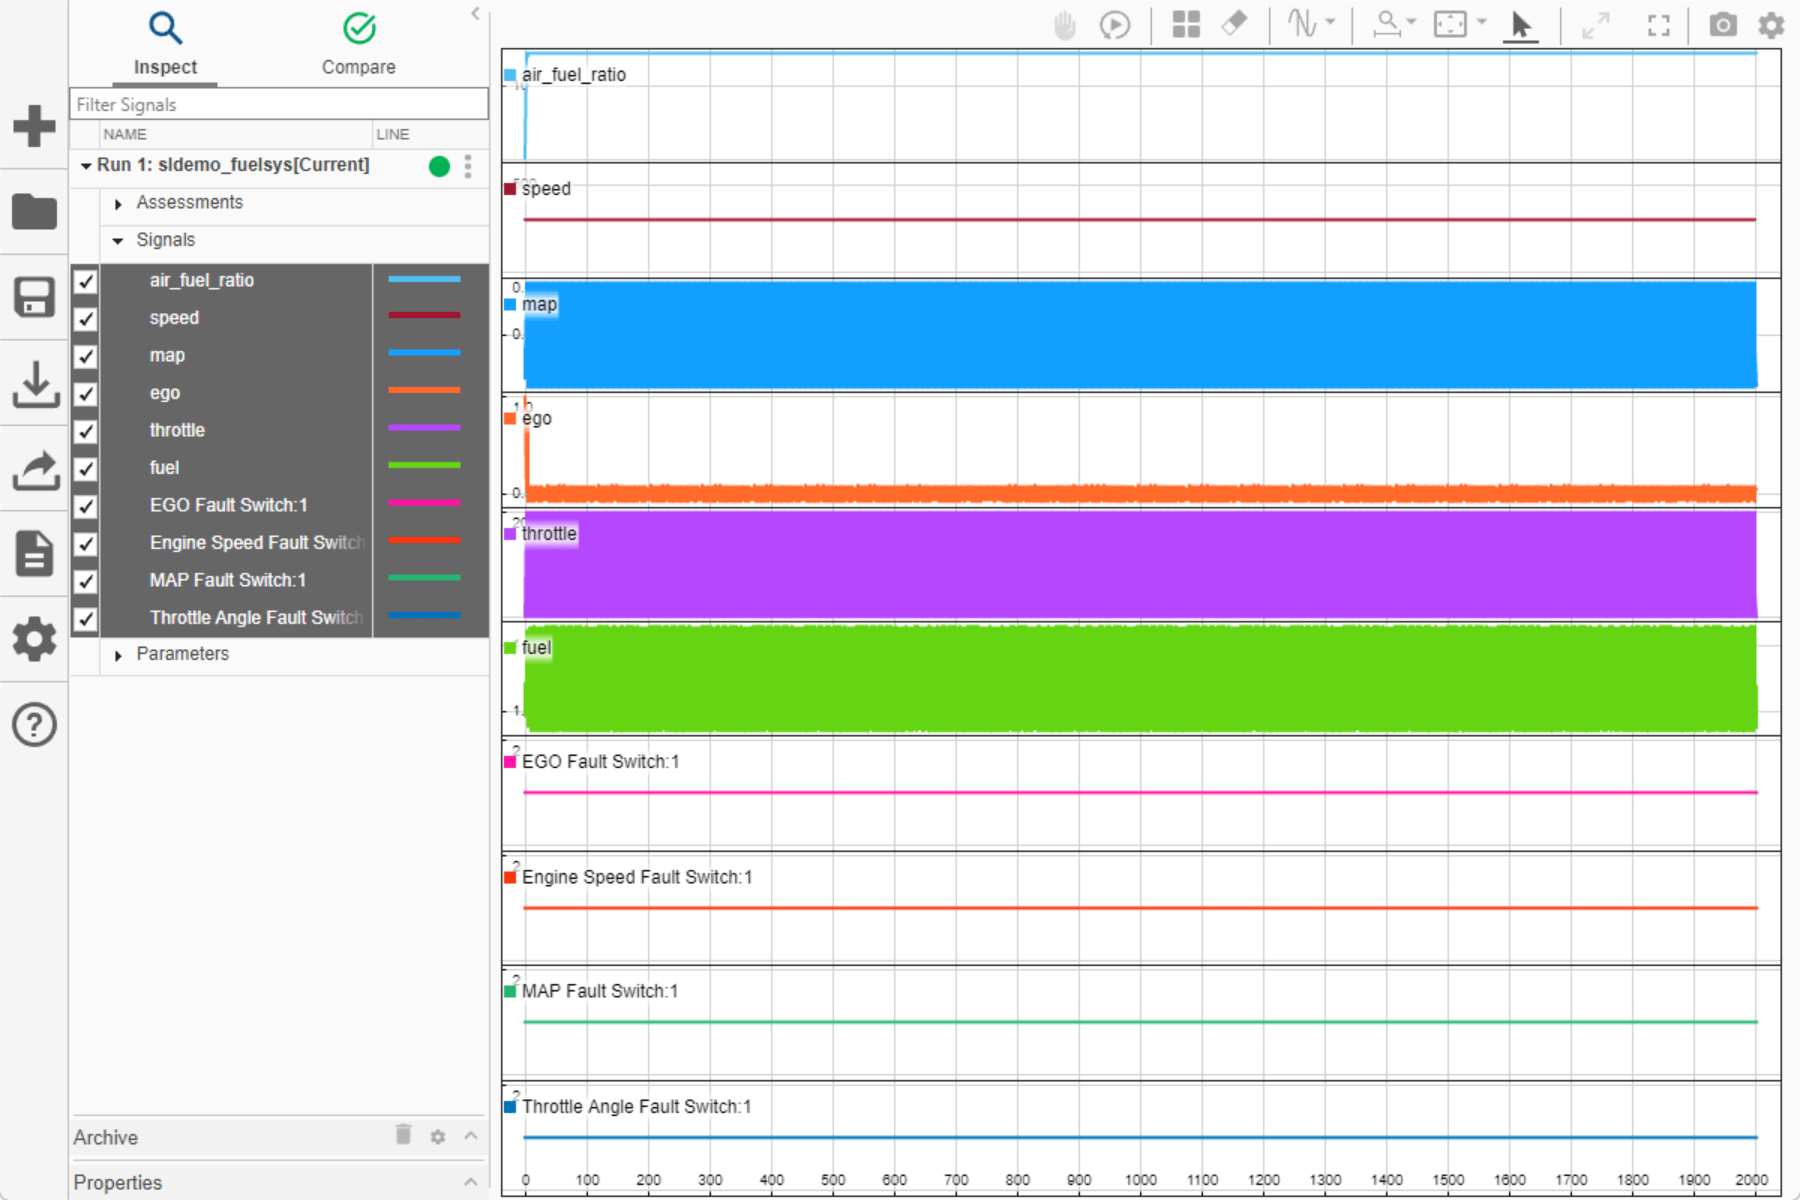
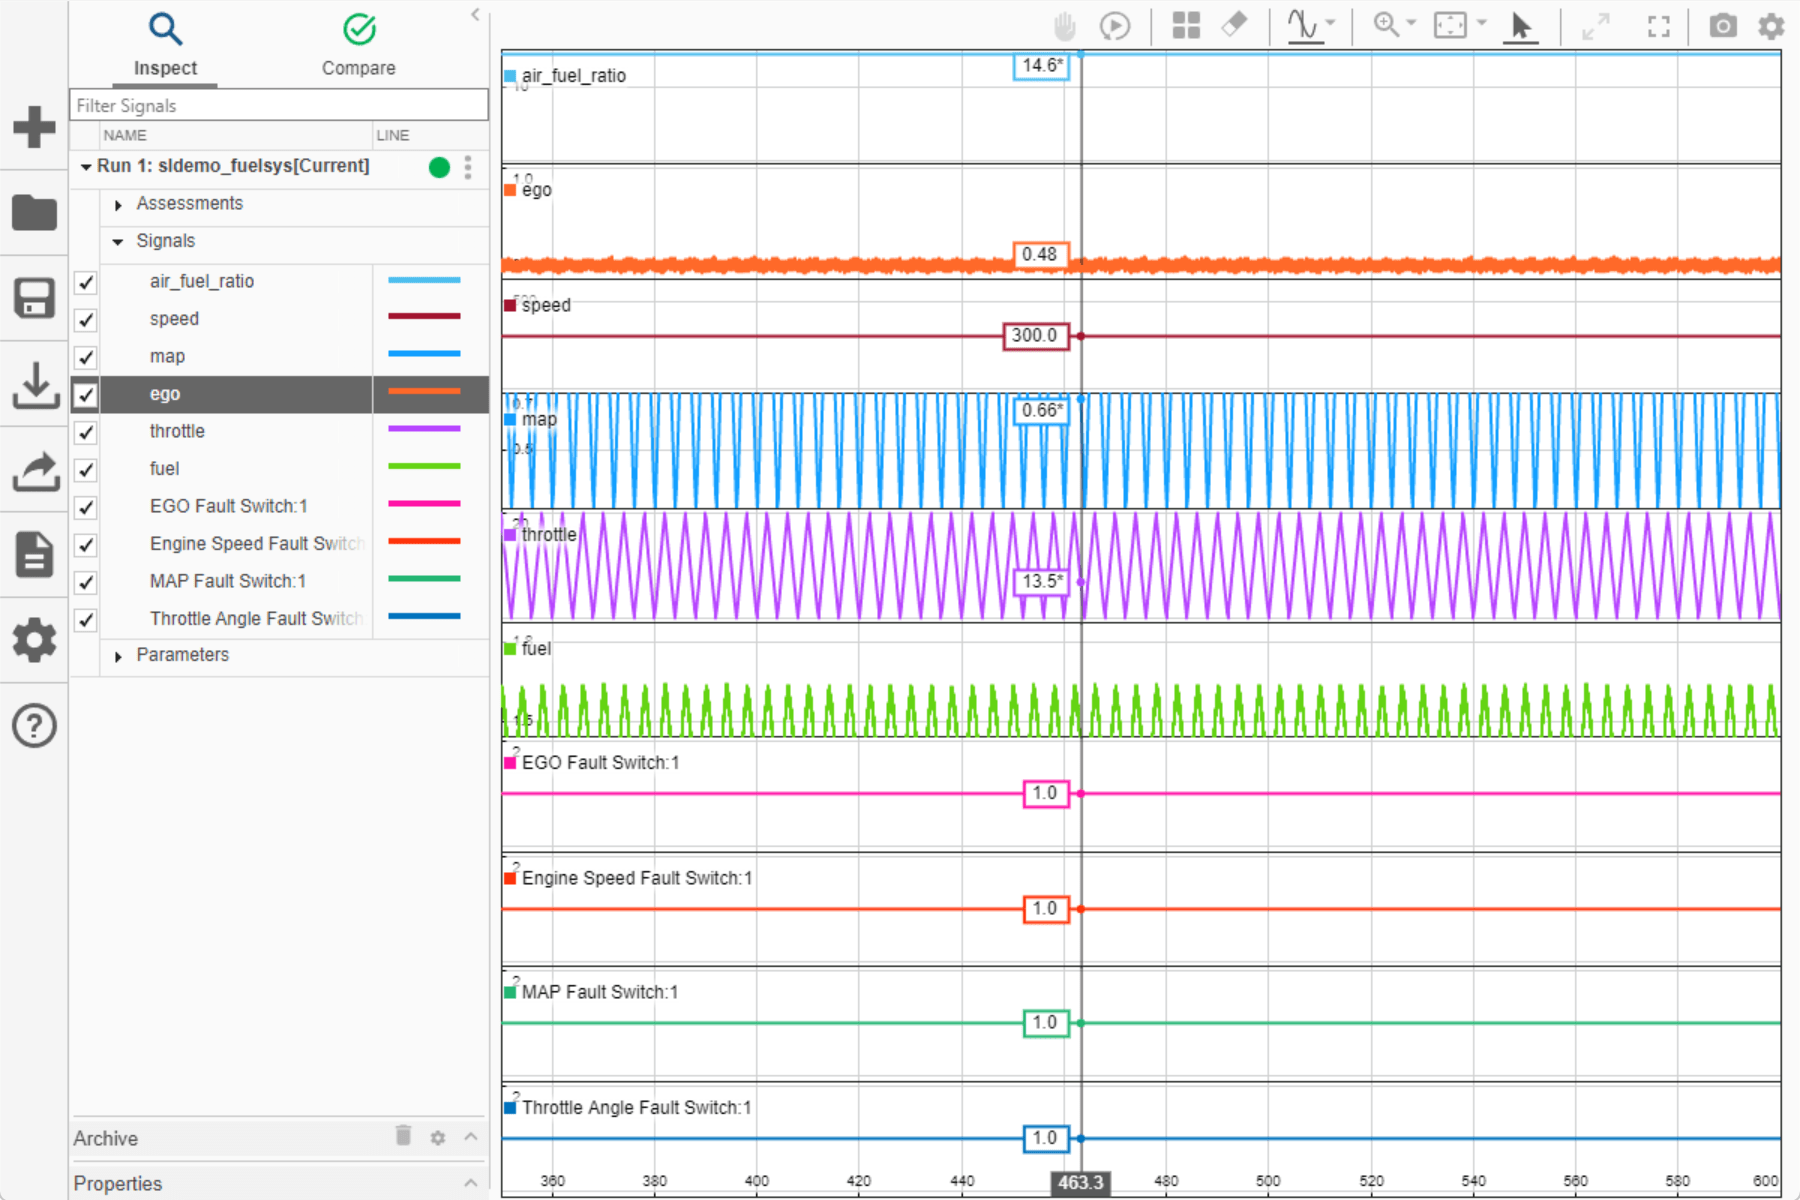
Expand the Signals group. You can add sparklines for the signals one by one by selecting the check box next to each signal you want to plot, or you can select a group of signals to drag onto the plot. Each signal is shown on its own sparkline.
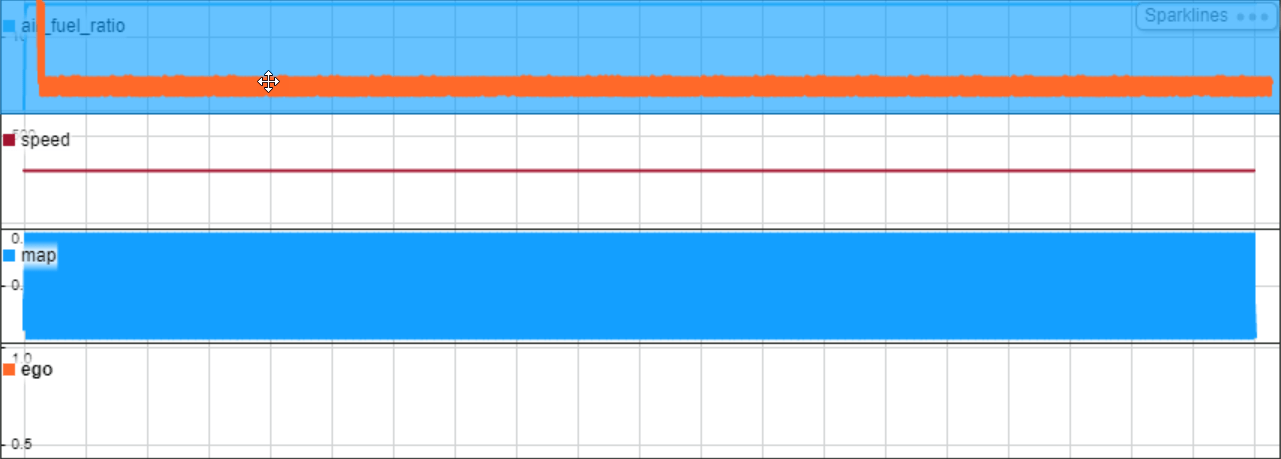
If you want to view more than one signal in a single sparkline, you can drag the signal line from one sparkline onto another. The sparkline for the signal you move disappears, and both signals are shown together on the sparkline where you drag the signal. For example, drag the ego signal into the top sparkline.
You can also reorder the sparklines by dragging the signal line and dropping it between two sparklines where you want that signal to appear. For example, drag the ego signal out of the top sparkline and drop it in between the first and second sparklines.

Inspect Data on Sparklines
You can add cursors to the sparklines plot to see the value for each signal at a given time. You can also use the replay controls with sparklines to inspect how the signal values change relative to each other over time. When you pan or zoom in a given sparkline, all other sparklines remain synchronized.
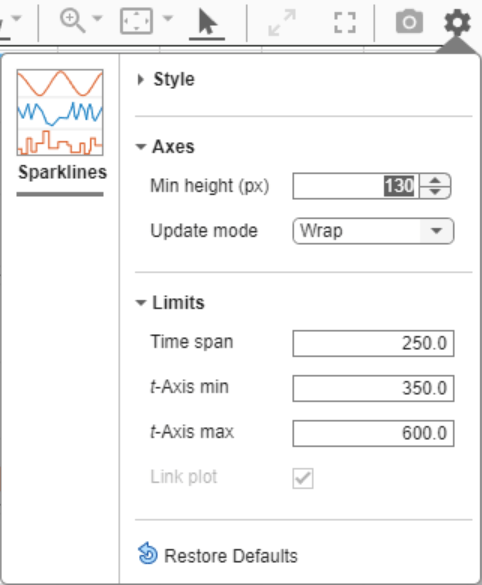
You can modify the appearance of a sparklines plot using the Visualization Settings and the subplot menu. To access the Visualization settings for the sparklines plot, click Visualization settings ![]() .
.
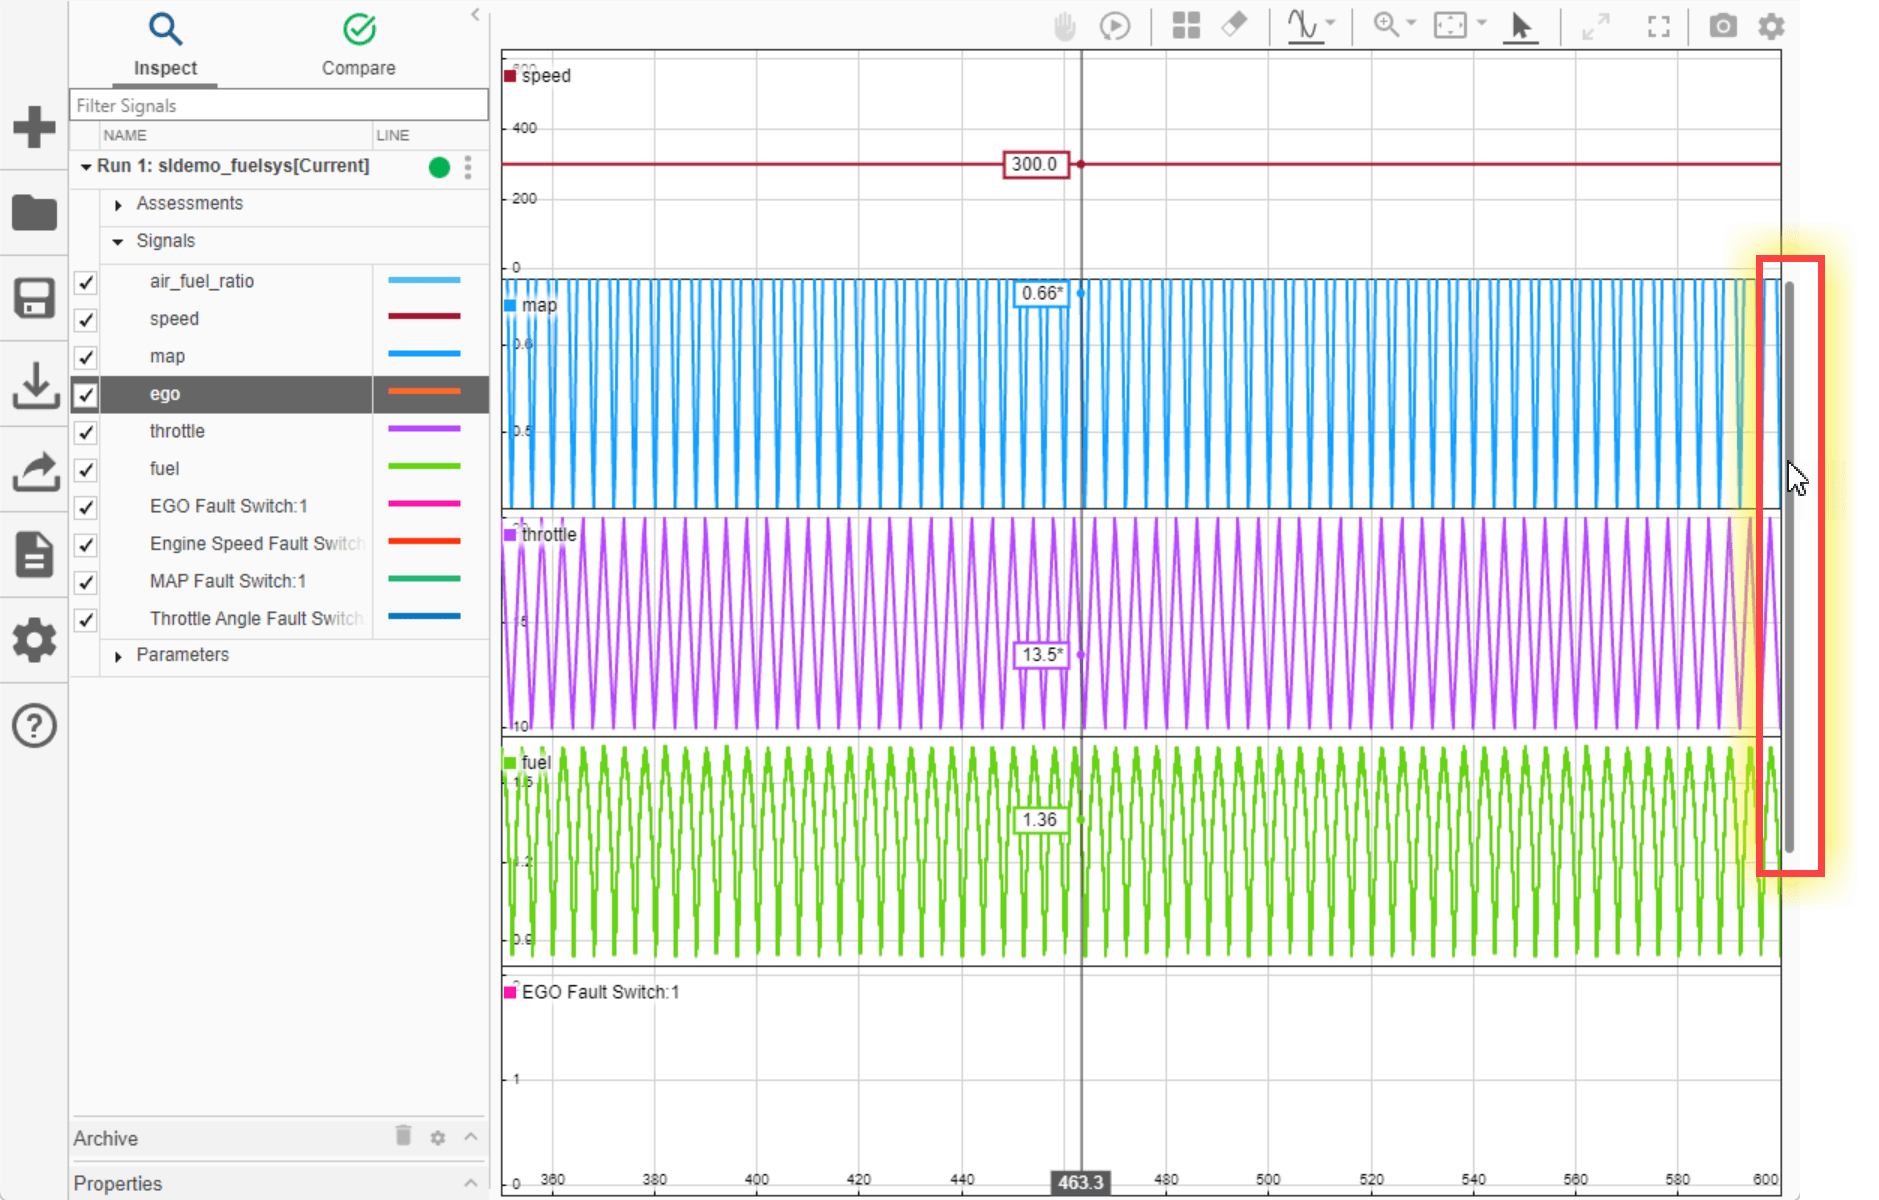
For example, increase the minimum height for each sparkline to 130 px. The values you specify in the Visualization settings are specific to a single sparklines visualization and apply to all sparklines within that sparklines plot.
With the larger minimum height, all the sparklines are not visible at once, and a scroll bar allows you to view all the signals. To scroll down, select the scroll bar with your mouse and drag.
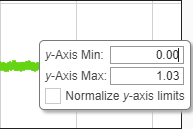
You can modify settings that apply only to a single sparkline within the sparklines plot using the subplot menu. For example, change the y-axis limits for the sparkline that displays the ego signal.
To open the subplot menu for the sparkline, pause on the sparkline then click the three dots that appear.

To open the sparkline-specific visualization settings, click Sparkline settings ![]() . In the menu that appears, change the minimum value for the y-axis to
. In the menu that appears, change the minimum value for the y-axis to 0.
To clear the Sparkline Settings menu, click outside the menu.
View Data on a Sparklines Plot During Simulation
During simulation, plotted signals stream data to the sparklines visualization. You can control how the signal data is displayed as well as how and when the sparklines update using the Update mode and Time span settings in the Visualization settings ![]() . Change Update mode to
. Change Update mode to Scroll and set Time span to 100. Then, simulate the model again.
out = sim(mdl);
By default, the Simulation Data Inspector automatically moves the previous run into the archive and plots signals from the current simulation in the place of plotted signals from the prior simulation. To inspect a signal of interest during simulation, you can pause the drawing of a streaming signal by clicking Hold ![]() .
.
Before 2023b: Click Freeze display ![]() to prevent wrapping or scrolling of the display.
to prevent wrapping or scrolling of the display.
Alternatively, you can use a trigger to control when the sparklines plot updates. For more information, see Control Display of Streaming Data Using Triggers