Identify and Troubleshoot Gaps in Code Testing Results and Coverage
You can identify and troubleshoot common issues in code testing results and coverage by using the SIL Code Testing and PIL Code Testing dashboards. After you complete model testing, you can use the dashboards to assess the status of your software-in-the-loop (SIL) and processor-in-the-loop (PIL) testing. The dashboards use metrics to measure the quality and completeness of test results and coverage and summarize the metric results in widgets. When you click on a widget, you can view detailed metric results and use hyperlinks to directly open artifacts with issues. Use the code testing dashboards after completing model testing with the Model Testing Dashboard to help demonstrate equivalence between software units and their associated code.
This example shows how to assess the status of SIL testing by using the SIL Code Testing dashboard, but you follow the same steps to analyze PIL testing in the PIL Code Testing dashboard. The PIL Code Testing dashboard uses the same layout as the SIL Code Testing dashboard, but the metric results come from PIL tests.
Check Completeness of Model Testing Results
1. Open a project that contains the models and testing artifacts that you want to analyze. Open an example project that has incomplete testing results by entering this code in the MATLAB® Command Window:
openExample('shared_vnv/FixRequirementsBasedTestingIssuesExample')
openProject("cc_CruiseControl");
This command creates a copy of the dashboard example project in your example projects directory. The example project contains several models and tests, but does not include any test results.
2. Get model and SIL code testing results by running a test in Normal and Software-in-the-Loop (SIL) mode, respectively. Typically, you run each of your tests in both simulation modes. For this example, run this code:
% get test case "Detect set"
cp = currentProject;
rf = cp.RootFolder;
tf = fullfile(rf,"tests","cc_DriverSwRequest_Tests.mldatx");
tfObj = sltest.testmanager.load(tf);
tsObj = getTestSuites(tfObj);
tcObj = getTestCases(tsObj);
tc3 = tcObj(3);

% run as model test (SimulationMode = 'Normal')
run(tc3,SimulationMode='Normal');

% run as code test (SimulationMode = 'Software-in-the-Loop (SIL)')
run(tc3,SimulationMode='Software-in-the-loop (SIL)');
The code gets the test case Detect set from the example project, runs the test using the Normal simulation mode, and then runs the same test again using the Software-in-the-Loop (SIL) simulation mode. For equivalence testing (also called back-to-back testing), it is important to use the same test in both the model testing and code testing environments, which is why the code only changes the value of the SimulationMode argument when running the test case. For more information about the SimulationMode argument, see run (Simulink Test).
3. Check the status of model testing results by using the Model Testing Dashboard. To open the dashboard: on the Project tab, click Model Testing Dashboard or enter:
modelTestingDashboard
You can use the Model Testing Dashboard to view an overview of the model testing results and the compliance status for each software unit in your project.
The Model Testing Dashboard has four main sections: the toolstrip, the Project panel, the Artifacts panel, and the dashboard tab. The Project panel displays artifacts from the current project that are compatible with the currently selected dashboard. For the model and code testing dashboards, the Project panel shows the available units in the project. You can click on a unit in the Project panel to view the metric results for that unit in the dashboard.
4. For this example, view the metric results for the software unit cc_DriverSwRequest. In the Project panel, click cc_DriverSwRequest.
The Model Testing Dashboard shows the metric results for cc_DriverSwRequest. In the Simulation Test Result Analysis section of the dashboard, under Model Test Status, you can see that the 1 test has the status Failed and 6 tests have the status Not Run. Before analyzing the code testing results, you typically run each of these model tests and fix the failing results. But for this example, do not fix the failing test and continue to the code testing results. For information on how to run tests and fix failing test results using the Model Testing Dashboard, see Fix Requirements-Based Testing Issues.
View Status of Code Testing and Address Non-Compliant Results
1. View an overview of the SIL code testing results for the software unit cc_DriverSwRequest by opening the SIL Code Testing dashboard. In the toolstrip, in the Add Dashboard section, click SIL Code Testing.
The SIL Code Testing dashboard opens in a new tab next to the tab for the Model Testing Dashboard. The SIL Code Testing dashboard contains two main sections: SIL Test Results and SIL Coverage Results.
For this example, notice that in the SIL Test Results section, the Test Summary widget shows that 0% of SIL tests have the status Passed. If you look at the Test Status widget, you can see that 1 SIL test has the status Failed and 6 SIL tests have the status Not Run. Under Test Failures, the SIL only and Model widgets show that 0 SIL tests failed only in SIL code testing and that 1 SIL test failed during both model testing and SIL code testing. The Model widget in the SIL Code Testing dashboard shows the same metric information as the Failed widget in the Model Testing Dashboard, so if there are any model testing failures, you can also see that information directly from the SIL Code Testing dashboard.
The Test Summary widget shows the Non-Compliant icon ![]() if fewer than 100% of SIL tests pass.
if fewer than 100% of SIL tests pass.
2. Fix the source of the test failure. In this example project, the Detect set test failed both model and SIL code testing because the model cc_DriverSwRequest.slx uses the wrong enumerated value. To fix the issue, run this code:
load_system(fullfile(rf, "models", "cc_DriverSwRequest.slx"));
set_param("cc_DriverSwRequest/Const_reqMode_Set", "Value", "db_Request_Enum.SET")
close_system("cc_DriverSwRequest.slx", 1);
The code loads the model, updates the value, and closes the model.
3. Retest the model by rerunning this code:
% get test case "Detect set"
cp = currentProject;
rf = cp.RootFolder;
tf = fullfile(rf,"tests","cc_DriverSwRequest_Tests.mldatx");
tfObj = sltest.testmanager.load(tf);
tsObj = getTestSuites(tfObj);
tcObj = getTestCases(tsObj);
tc3 = tcObj(3);

% run as model test (SimulationMode = 'Normal')
run(tc3,SimulationMode='Normal');

% run as code test (SimulationMode = 'Software-in-the-Loop (SIL)')
run(tc3,SimulationMode='Software-in-the-loop (SIL)');
4. In the SIL Code Testing dashboard, click Collect and inspect the updated metric results in the dashboard.
The Test Summary widget shows that now 14.3% of SIL tests have the status Passed. Under Test Failures, the Model widget shows that there are currently 0 failures in the model testing results.

Before analyzing the SIL coverage results, you typically run tests that have not run yet and fix any failing test results. But for this example, leave the tests that have not run and continue to analyze the results in the dashboard.
Note that you can also analyze the status of back-to-back testing. For information, see Evaluate Status of Back-to-Back Testing for Software Units.
Identify Non-Compliant Coverage Results
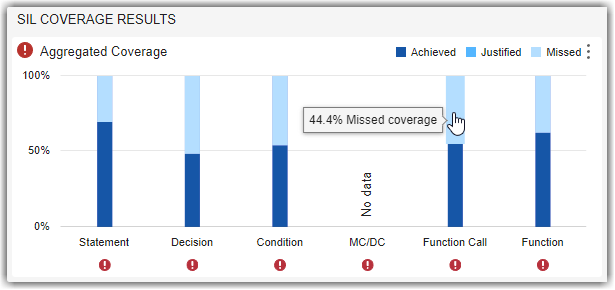
In the SIL Coverage Results section, the Aggregated Coverage widget shows statement, decision, condition, MC/DC, function call, and function coverage aggregated from across the unit. For compliance, 100% of aggregated coverage must be completed, either by achieving the coverage through code testing or justifying the coverage using coverage filters.
Identify what percentage of each coverage type was achieved, justified, or missed. If the Aggregated Coverage widget shows that you are missing coverage, consider adding more tests or justifying the missing coverage.
For this example, point to the two Function Call bars in the bar chart. The unit achieved 55.6% of function call coverage, but missed 44.4% of function call coverage during SIL code testing.
If the Aggregated Coverage widget shows that you are missing Function Call or Function coverage, you need to address those coverage gaps by running tests that have not run yet, adding additional code tests, or justifying the missing coverage. Function Call and Function coverage are specific to code testing and there is no direct model testing equivalent that you can change to correct this missing coverage.
Investigate Gaps in Coverage
To investigate coverage gaps in more detail, use the Coverage Recap widget to identify gaps and find unexpected differences in model and code coverage results. Note that the dashboard considers coverage to be completed if the coverage was either achieved or justified.
When you read the table in the Coverage Recap widget:
Check that 100% of integer overflow coverage completed during model testing.
See coverage types that have better code coverage than the model coverage.
Check that 100% of model coverage completed during model testing.
See coverage types that have better model coverage than code coverage.
Check that 100% of code coverage completed during code testing.
For more information on coverage, see Evaluate Differences Between Model and Code Coverage (Simulink Coverage).
Identify Missing Integer Overflow Coverage
Inspect the integer overflow coverage for the model by using the Integer Overflow row.
The first row of the Coverage Recap table shows the Integer Overflow coverage that is justified or completed during model and code testing. Integer Overflow coverage is always N/A for code testing results because integer overflow coverage is specific to model testing. In this example, the Completed Model column shows 100% integer overflow coverage.
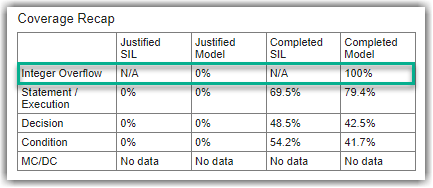
If the Integer Overflow row shows less than 100% Completed Model coverage, you need to run any tests that have not run, add model tests, or justify the missing model coverage. Address gaps in Integer Overflow coverage through model testing and not code testing. You can review the model testing results in the Model Testing Dashboard and troubleshoot missing integer overflow coverage using the Int. Overflow bar in the Model Coverage widget. For more information, see Explore Status and Quality of Testing Activities Using Model Testing Dashboard.
Identify Other Sources of Missing Model Coverage
Identify any coverage types that have better code coverage than the model coverage.
The Completed SIL column shows completed code coverage.
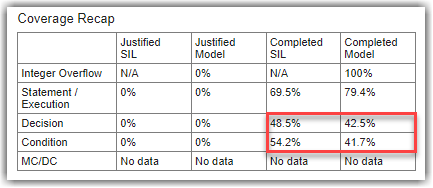
If the Completed SIL percentage is greater than the Completed Model percentage for a coverage type, the code might contain functionalities that you can test by code testing but you did not fully test during model testing. For example, when you generate code, the model can create reused functions that the existing code tests can test more fully than the model tests. In those instances, you might need to justify the model coverage or add tests that more fully test the upstream modeling constructs in the code.
Inspect the state of model coverage by using the Completed Model column.
The Completed Model column shows the overall status of model coverage for each coverage type. In this example, the Statement/Execution, Decision, and Condition rows show that there was less than 100% coverage of these coverage types achieved or justified during model testing. The tests did not collect MC/DC coverage results, so the MC/DC row shows No data.
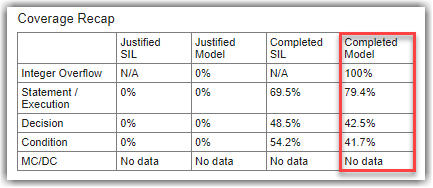
If the Completed Model column shows less than 100% coverage for any coverage type, you need to review and address the missing coverage through model testing. You can review the model testing results in the Model Testing Dashboard and troubleshoot missing coverage by using the Model Coverage widget. For more information, see Explore Status and Quality of Testing Activities Using Model Testing Dashboard.
For this example, leave the model coverage incomplete and continue to analyze the results in the dashboard.
Identify Where Code Coverage Is Less Than Model Coverage
Suppose you add tests to address the missing model coverage and the Model Coverage column shows improved model coverage results.
Inspect the rows where the code coverage in the Completed SIL column is less than the model coverage in the Completed Model column.
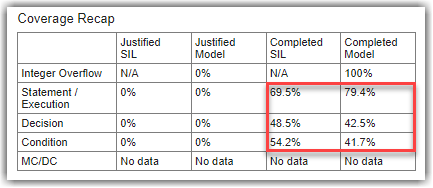
If the Completed SIL percentage is less than the Completed Model percentage for a coverage type, there might be functionalities in the generated code that your existing tests do not cover. For example, if your generated code uses a code replacement library, lookup table, or other code-specific functionality, your existing tests might cover your model, but do not fully test those coding constructs. You might need to add tests that directly test these generated coding constructs or justify the missing coverage.
Identify Other Sources of Missing Code Coverage
Inspect the rows where code coverage is less than 100%.
The Completed SIL column shows the overall status of code coverage for each coverage type.
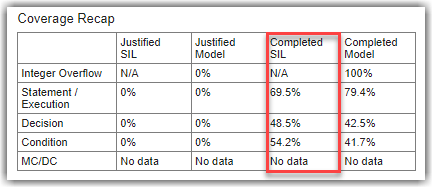
If the Completed SIL column still shows less than 100% coverage, check the Justified SIL and Justified Model columns to see if you have more justifications for model coverage than for code coverage.
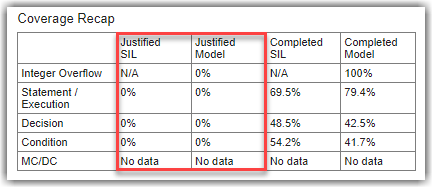
If Justified Model percentage is greater than Justified SIL percentage for a coverage type, you might need to update your coverage filter to apply the justifications you made in the model coverage to your code coverage.
See Results for Multiple Dashboards
When you review the model and code testing dashboards, it is helpful to have the Model Testing dashboard tab open next to the SIL Code Testing dashboard tab.
You can rearrange the dashboard tabs to see the Model Testing dashboard tab and SIL Code Testing dashboard tab are side-by-side by right-clicking the a tab and selecting Tile All > Left/Right.
