View Status of Code Testing Activities for Software Units in Project
The SIL Code Testing and PIL Code Testing dashboards analyze artifacts in a project, like models and test results, and collect metrics that help you see the status of code testing activities for your project. The SIL Code Testing dashboard provides an overview of software-in-the-loop (SIL) testing and the PIL Code Testing dashboard provides an overview of processor-in-the-loop (PIL) testing. Each metric in the dashboards measures a different aspect of the quality of your code testing and reflects guidelines in industry-recognized software development standards, such as ISO 26262 and DO-178C. Use the code testing dashboards after completing model testing with the Model Testing Dashboard to help perform equivalence testing between software units and their associated code.
With the metric results in the dashboard, you can:
See a summary of the code testing results, back-to-back testing results, and code coverage for your software unit.
View code testing results in context with relevant model testing results.
View detailed information about the testing artifacts in a project.
Monitor progress towards compliance with industry standards like ISO 26262 and DO-178C.
Identify and troubleshoot issues in the project to reach compliance with code testing requirements.
You can click widgets in the dashboards to see detailed information about the current results and use hyperlinks to open the affected artifacts. You can view the metric results directly in the dashboard, generate a report for offline review, or collect the metrics programmatically.
This page shows how to assess the status of SIL testing by using the SIL Code Testing dashboard, but you follow the same steps to analyze PIL testing in the PIL Code Testing dashboard. The code testing dashboards use the same layout, but the metric results come from either SIL or PIL tests, respectively.
Note
Before you review the code testing results in detail, review and address any noncompliant model testing results in the Model Testing Dashboard. Since models are upstream of the generated code, there are some code testing issues that you can only address during model testing. The model testing results refer to results from running tests in normal simulation mode. For information on how to review and fix model testing results, see Fix Requirements-Based Testing Issues.
View Code Testing Status
You can view the status of code testing for each of the software units in a project by using the code testing dashboards.
To open a SIL Code Testing or PIL Code Testing dashboard:
Open a project. If you do not have a project, you can create a project directly from your model. For information, see Create Project to Use Model Design and Model Testing Dashboards.
On the Project tab, click Model Testing Dashboard or, in the MATLAB® Command Window, enter:
modelTestingDashboard
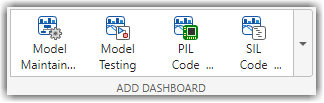
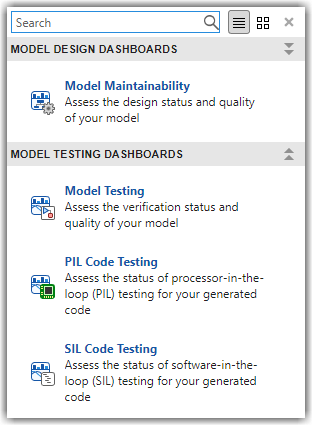
View the available dashboards by expanding the dashboards gallery in the Add Dashboard section of the toolstrip. Click SIL Code Testing to open the dashboard for SIL results. You can also click PIL Code Testing to open the dashboard for PIL results.
The SIL Code Testing and PIL Code Testing dashboards are two types of model testing dashboards.
The dashboard widgets show a summary of the metric results for the selected software unit. By default, the dashboard opens for the first software unit listed in the Project panel. You can click a different unit in the Project panel to view the model testing results for that unit. For this example, click the unit cc_DriverSwRequest. For more information about the Project and Artifacts panels, see Analyze Your Project with Dashboards.
The following images show metric results for a project that already has model testing and SIL testing results. For information on how to collect the model and code testing results and how to address testing issues, see Identify and Troubleshoot Gaps in Code Testing Results and Coverage.
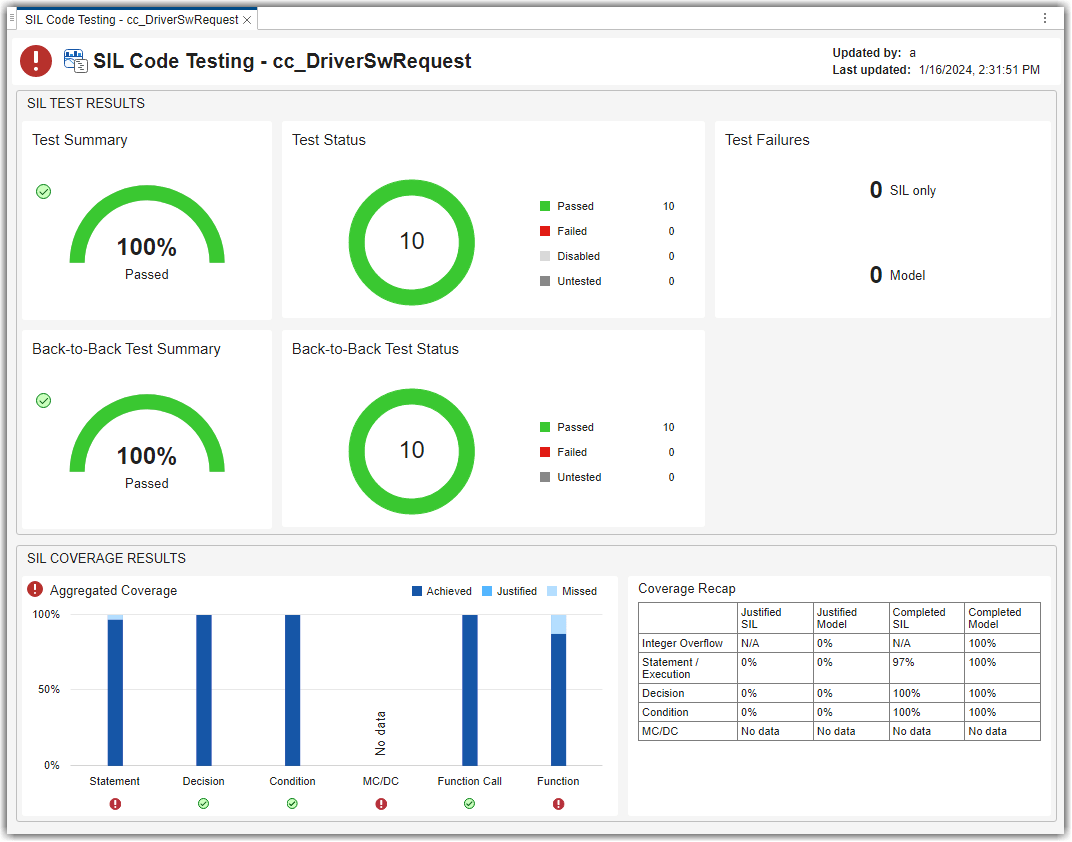
Review Test Status and Coverage Results
The dashboard is split into two main sections that contain individual widgets showing metric results:
Test Results

Coverage Results
To view information about the metric results in the widget, point to the widget. Three dots appear in the top-right corner of the widget.

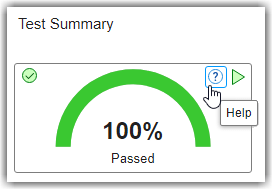
Point to the three dots and click the Help ![]() icon to view information about the metric and how
the dashboard calculates the metric results.
icon to view information about the metric and how
the dashboard calculates the metric results.
To explore metric results in more detail, click the widget itself. A table lists the artifacts in the unit and their results for the metric. The table provides hyperlinks to open each artifact so that you can view details about the artifact and address testing quality issues.
Assess Test Results
The Test Results section shows metric results for code testing results. For information on how to collect and fix code testing results, see Identify and Troubleshoot Gaps in Code Testing Results and Coverage and Evaluate Differences Between Model and Code Coverage (Simulink Coverage).
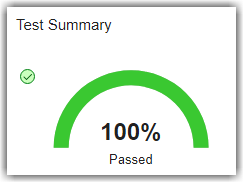
Test Summary
For code testing results to be compliant, 100% of code tests must pass.
You can view the percentage of tests that pass in the Test Summary widget.
If less than 100% of tests pass, the widget shows the red
Non-Compliant overlay icon ![]() . Use the Test Status,
SIL only, and Model widgets to
identify and fix testing issues.
. Use the Test Status,
SIL only, and Model widgets to
identify and fix testing issues.
Test Status
If you have tests that did not pass, you can use the Test Status widget to identify which specific tests did not pass. The Test Status widget shows the number of tests that passed, failed, are untested, have not run, or are disabled.
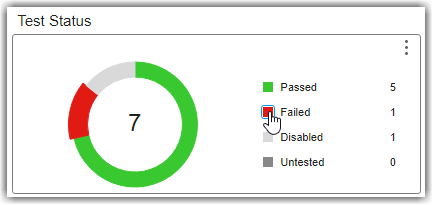
You can click the icons in the widget to explore the metric results in more
detail. For example, if you click the icon next to Failed
![]() you can view detailed metric results. The
results include a table that lists the failed tests in the unit and provides
hyperlinks to open the associated test files.
you can view detailed metric results. The
results include a table that lists the failed tests in the unit and provides
hyperlinks to open the associated test files.
To address these issues, run the tests that have not run yet, confirm that the disabled tests can remain disabled, and address failed or untested tests.
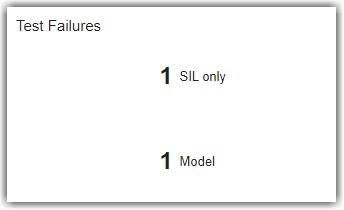
Test Failures
Use the Test Failures group to identify which failures only occurred in either model testing or code testing. The group contains two widgets:
SIL only — Number of tests that passed during model testing but failed during SIL testing. If the SIL only widget shows a number greater than 0, investigate and fix the code testing failures before analyzing coverage results.
Model — Number of tests that failed during model testing. If the Model widget shows a number greater than 0, investigate and fix the issue using the Model Testing Dashboard. You should try to address model-only failures through model testing and not code testing.
Back-to-Back Test Summary
For each test in the software unit, the dashboard compares the normal mode and SIL or PIL mode test runs to determine the status of back-to-back testing for the model and the generated code.
For back-to-back testing results to be compliant, 100% of tests must pass. You can view the percentage of tests that pass in the Back-to-Back Test Summary widget.
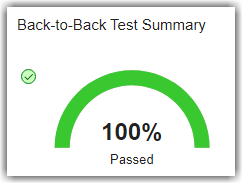
If less than 100% of tests pass, the widget shows the red
Non-Compliant overlay icon ![]() .
.
Back-to-Back Test Status
If you have tests that did not pass back-to-back testing, you can use the Back-to-Back Test Status widget to identify which specific tests did not pass. The widget shows the number of tests that passed, failed, or have not run back-to-back.
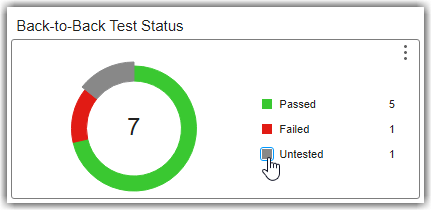
You can click the icons in the widget to explore the metric results in more
detail. For example, if you click the icon next to Not Run
![]() you can view detailed metric results. The
results include a table that lists the tests in the unit that have not run yet
and provides hyperlinks to open the associated test files.
you can view detailed metric results. The
results include a table that lists the tests in the unit that have not run yet
and provides hyperlinks to open the associated test files.
To address these issues, make sure to run tests in both simulation modes (normal mode and either SIL or PIL mode) and address failed or untested tests.
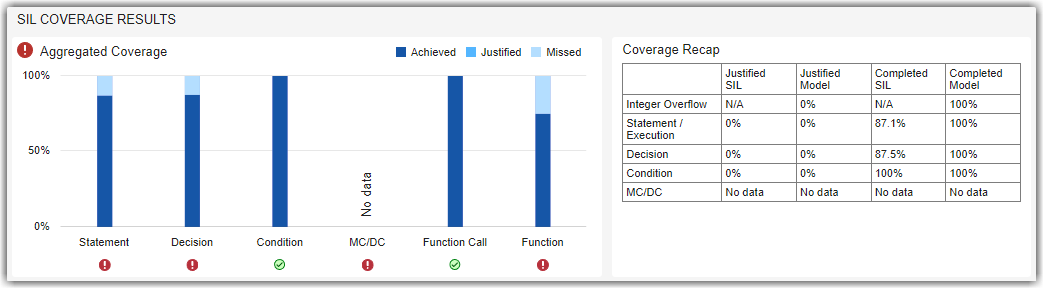
Analyze Coverage Results
The Coverage Results section shows metric results for code coverage results. For information on how to collect and fix code coverage results, see Identify and Troubleshoot Gaps in Code Testing Results and Coverage.
Aggregated Coverage
For code coverage to be compliant, 100% of the aggregated coverage must be completed for the coverage types that your unit testing requires. To determine your required coverage types, consider the safety level of your software unit. The dashboard considers coverage completed if the coverage is either achieved by code testing or justified using coverage filters.
You can view the aggregated statement, decision, condition, MC/DC, function call, and function coverages for the unit in the Aggregated Coverage widget.
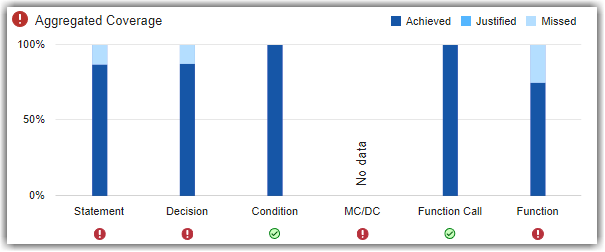
If a coverage type has less than 100% coverage, the widget shows the red
Non-Compliant overlay icon ![]() . Use the Coverage Recap
widget to identify and fix coverage issues.
. Use the Coverage Recap
widget to identify and fix coverage issues.
Coverage Recap
Use the Coverage Recap widget to see the justified and completed coverage for both model and code testing. The dashboard considers coverage to be completed if the coverage was either achieved or justified.
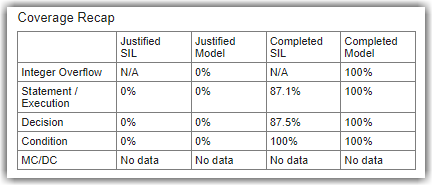
Use this widget to help you identify issues across model and code testing results. For example:
You can identify tests that you justified during model testing but did not justify for SIL code testing.
If there was a gap in integer overflow coverage during model testing, you need to go back and address that gap in the model testing. Use the Model Testing Dashboard to identify and fix the source of the missing coverage. You can see integer overflow coverage in the Aggregated Coverage widget in the Model Testing Dashboard.