Refine Highlighted Model Slice by Using Model Slicer Data Inspector
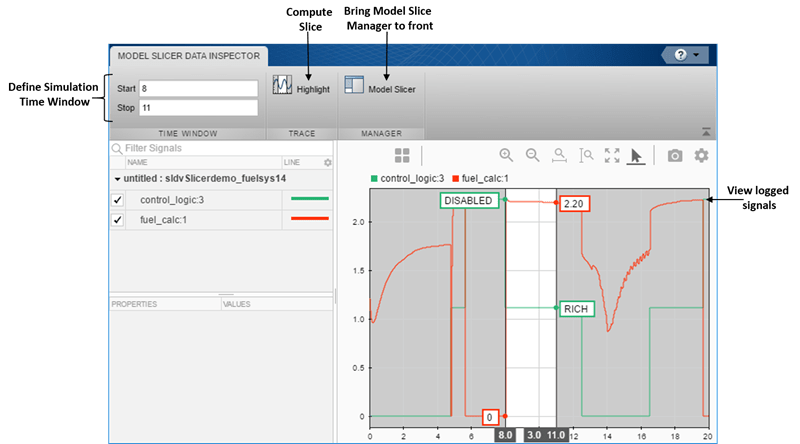
Using the Model Slicer Data Inspector, you can inspect logged signals and refine the highlighted model slice. To refine the highlighted model slice, select the time window in the graphical plot by using data cursors.
In the Model Slicer Data Inspector, you can:
View signals — Inspect logged signal data after model simulation. See Inspect Simulation Data.
Select simulation time window — Define simulation time window by using data cursors in the graphical plot or by defining the Start and Stop time in the Inspector.
Highlight — Compute a slice for the defined simulation time window. See Highlight Functional Dependencies.

Investigate Highlighted Model Slice by Using Model Slicer Data Inspector
This example shows how to investigate and refine the highlighted model slice by using the Model Slicer Data Inspector.
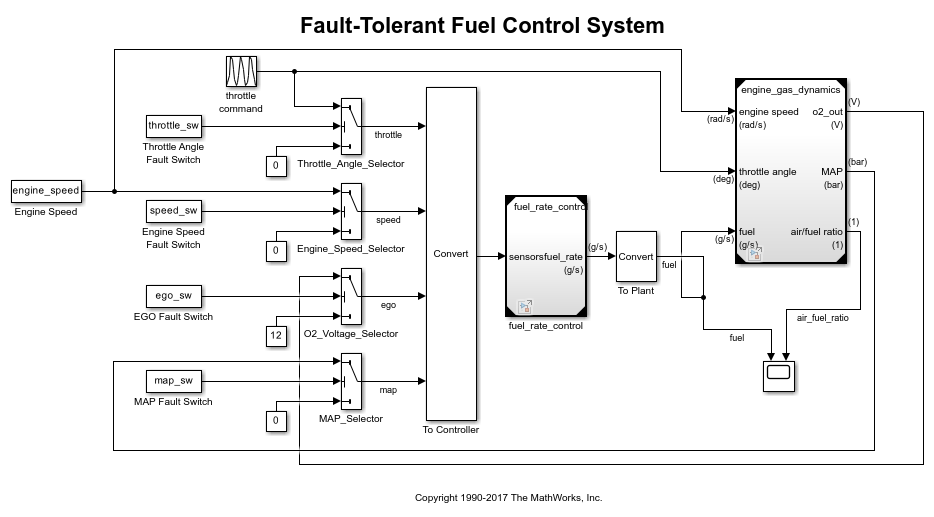
In the fault-tolerant fuel control system, the control_logic controls the fueling mode of the engine. In this example, you slice the fuel_rate_control referenced model. Then, investigate the effect of fuel_rate_ratio on the Fueling_mode of the engine. For more information, see Model Fault-Tolerant Fuel Control System.
Start the Model Slicer
To start the Model Slicer, open the fuel_rate_control model, and select Apps > Model Verification, Validation, and Test > Model Slicer.
open_system('sldvSlicerdemo_fuelsys');

To select the starting point, open the fuel_rate_control model, and add the fuel-rate port and the fuel_mode output signal as the starting point. To add a port or a signal as a starting point, right-click the port or signal and in the Model Slicer app section, select the Add as Starting Point button.
Log input and output signals
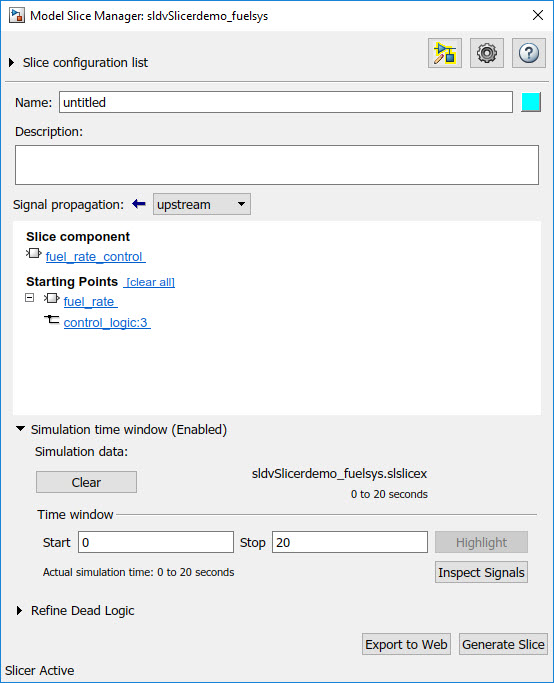
a. In the Model Slicer dialog box, select the Simulation time window and Run simulation.
b. In the Record simulation time window, for the Stop time, type 20.
c. Select the Log inputs and outputs of the starting points.
d. Click OK.


Inspect signals
To open the Model Slicer Data Inspector, click Inspect Signals.

The logged input and output signals appear in the Model Slicer Data Inspector. When you open the Model Slicer Data Inspector, Model Slicer saves the existing Simulation Data Inspector session as MLDATX-file in the current working directory.
You can select the time window by dragging the data cursors to a specific location or by specifying the Start and Stop time in the navigation pane. To highlight the model for the defined simulation time window, Click Highlight.
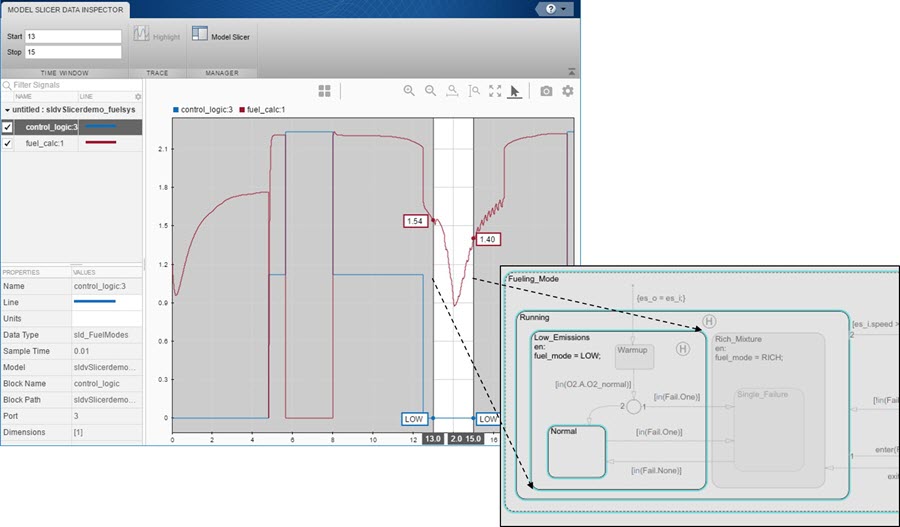
To investigate the Fueling_mode, open the control_logic Stateflow™ chart, available in the fuel_rate_control referenced model. Select the time window for 13–15 seconds and click Highlight. For the defined simulation time window, the Low_Emissions fueling mode is active and highlighted.

Select the data cursor for the time window 6–7.5 seconds, with 0 fuel_cal:1. Click Highlight. In the control_logic model, the Fuel_Disabled state is highlighted. The engine is in Shutdown mode.

See Also
Highlight Functional Dependencies | Refine Dependency Paths in Highlighted Model