Profiling and Tracing for Performance Optimization
Real-time applications running on target computers must meet strict timing and reliability requirements. To ensure optimal performance and correct execution flow, profiling and tracing are two essential techniques:
Profiling — measures the execution time of each function in an application and helps you to identify bottlenecks and optimize performance.
Tracing — captures the sequence of events and helps analyze execution flow and resource utilization.
Use profiling data to verify timing constraints, examine function call stacks, and optimize application design. Use tracing data to validate execution order, verify CPU usage, tune for multicore execution, and analyze event sequences.
To improve the performance of your real-time application, consider the following changes:
Change a single-rate model that is inherently multirate to a multirate model.
Use a multicore target computer, and then set the tasking mode to multitasking.
Determine the lower limit on sample time that does not produce a CPU overload.
Start profiler and tracer for a real-time application, and retrieve the results. Evaluate the results for potential improvements in the task and core distribution of the model.
For an inherently single-rate model, execute the real-time application on a multicore target computer with polling mode.
Objects
Target | Represent real-time application and target computer status |
Instrument | Create real-time instrument object |
slrealtime.instrument.LineStyle | Create real-time instrument LineStyle object (Since R2022b) |
Stimulation | Target computer model root inport stimulator object |
Functions
Blocks
| Log Event | Log an execution profiling event |
Topics
- Profiling Real-Time Applications
Enable profiling, collect execution timing data, and interpret results.
- Tracing Real-Time Applications
Enable tracing, collect execution flow, configure event logging, and use traces for debugging.
- Execution Modes for Real-Time Applications
Learn about the behavior of the interrupt and polling execution modes.
- Simulink Real-Time Options Pane
Configure initial values for real-time application options.
Related Information
Featured Examples
Concurrent Execution on Simulink Real-Time
Apply explicit partitioning to enhance concurrent execution of a real-time application that you generate by using Simulink Real-Time.
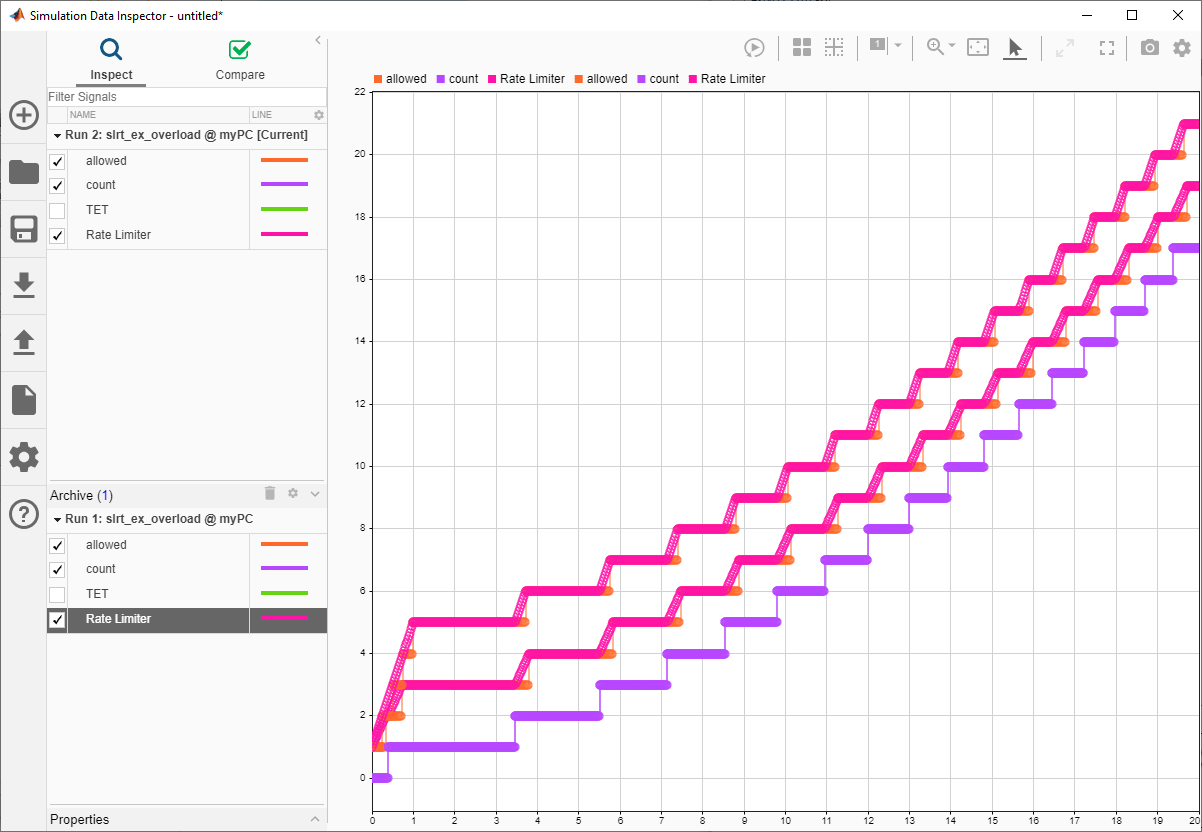
Monitor CPU Overload Rate
Design a model that uses the SLRT Overload Options block to monitor the rate at which CPU overloads occur.
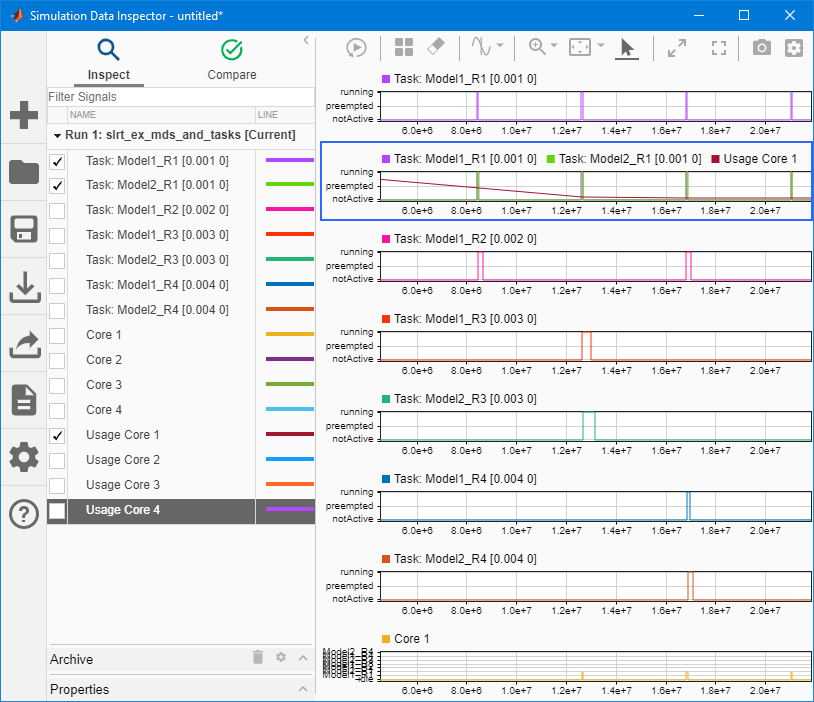
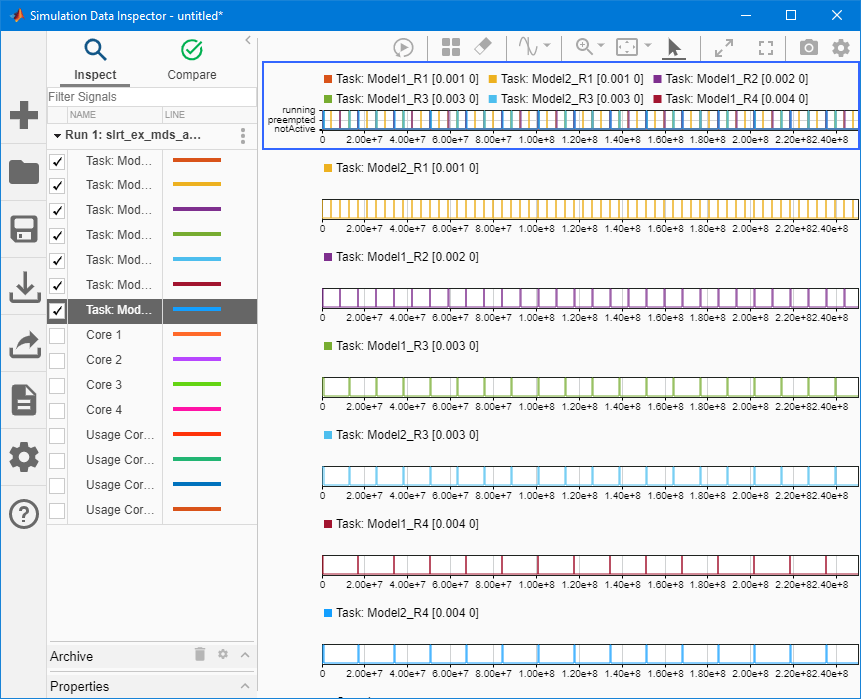
Execution Profiling for Real-Time Applications
Profile the task execution time and function execution time of your real-time application running on the target computer.
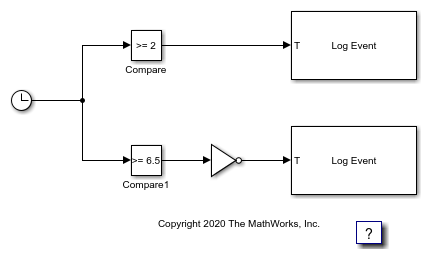
Insert Event into Execution Profiling Stream
Use the Log Event block to insert a user-defined event into the execution profiling event stream.