本页面提供的是上一版软件的文档。当前版本中已删除对应的英文页面。
探查与优化
通过使用 MATLAB® 函数实现执行探查、显示、分析与优化
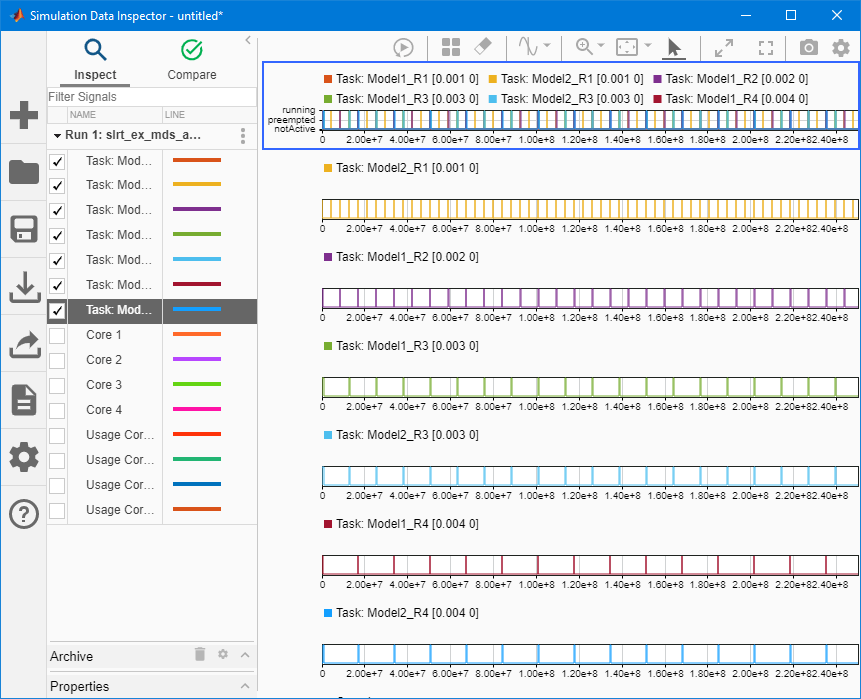
对目标计算机上运行的实时应用程序进行任务执行时间和函数执行时间的性能分析。然后,您可以调整它的性能。
对象
Target | 实时呈现应用程序和目标计算机的状态 |
Instrument | 创建实时仪表对象 |
slrealtime.instrument.LineStyle | 创建实时仪表线型对象 (自 R2022b 起) |
ProfilerData | 来自探查器的返回数据 |
Stimulation | 目标计算机模型根端口激励器对象 |
函数
startProfiler | 在目标计算机上启动探查服务 |
stopProfiler | 停止在目标计算机上对服务进行探查 |
getProfilerData | Download profiler data from target computer |
resetProfiler | 将探查服务状态重置为 Ready |
slrtTETMonitor | 打开 Simulink Real-Time 任务执行时间 (TET) 监控器 |
plot | |
report | |
getSupportInfo | Creates slrealtimeinfo.txt file that provides support information
about Simulink
Real-Time installation |
getCrashStack | 下载并解码目标计算机的崩溃堆栈核心文件,并在 MATLAB 编辑器中打开这些文件 |
模块
| Enable Profiler | 在目标计算机上启动和停止执行探查器 |
| Log Event |
主题
- Execution Modes for Real-Time Applications
Learn about the behavior of the interrupt and polling execution modes.
- Simulink Real-Time Options Pane
Configure initial values for real-time application options.
相关信息
精选示例
Simulink Real-Time 上的并发执行
对使用 Simulink Real-Time 生成的实时应用程序应用显式分区,以增强其并发执行能力。

监控 CPU 过载率
此示例展示了如何设计一个模型,该模型使用 SLRT Overload Options 模块来监测 CPU 过载发生的频率。

实时应用程序的执行分析
此示例演示了如何对目标计算机上运行的实时应用程序进行任务执行时间和函数执行时间的性能分析。
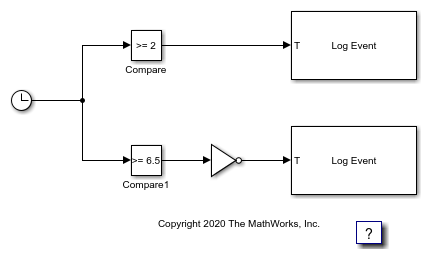
Insert Event into Execution Profiling Stream
Use the Log Event block to insert a user-defined event into the execution profiling event stream.