Visualize Links with Traceability Diagrams
You can visualize the traceability structure of requirements and other Model-Based Design items by using traceability diagrams. A traceability diagram graphically displays the links between an originating Model-Based Design item, such as a requirement, and the items linked to it, such as other requirements or Simulink® blocks. For more information, see Linkable Items.
In the diagram, items are nodes and links are edges. The item that you generate the diagram from is the starting node. You can also generate an artifact-level diagram, where the artifacts, such as requirement sets or Simulink models, are nodes, and the link sets are edges.
A traceability diagram displays all items linked to the starting node, including all upstream nodes and downstream nodes. If an upstream node has further upstream links, the diagram also displays those linked items. Similarly, the diagram displays further downstream linked items for downstream nodes.
Whether nodes are upstream or downstream is determined by the impact direction, which describes how changes propagate between nodes. An upstream node impacts the starting node. A downstream node is impacted by the starting node. The impact direction is determined by the link type. For more information, see Impact Direction.
You can use a traceability diagram to assess requirements allocation and change propagation between linked Model-Based Design items. For more information, see Assess Allocation and Impact.
Generate Traceability Diagrams
You can create a traceability diagram from these objects:
If you create a traceability diagram from a link, then the link source
item is
the starting node. Similarly, if you create a traceability diagram from a link set, then
the link set Artifact is the starting node.
To create a traceability diagram:
In the Requirements Editor, select the item and click Traceability Diagram.
In the Requirements Editor, right-click the item and select View Traceability Diagram.
At the MATLAB® command line, use
slreq.generateTraceabilityDiagram
.
You can create a new diagram from a node in an existing diagram by right-clicking the node and selecting View Traceability Diagram.
Types of Traceability Diagrams
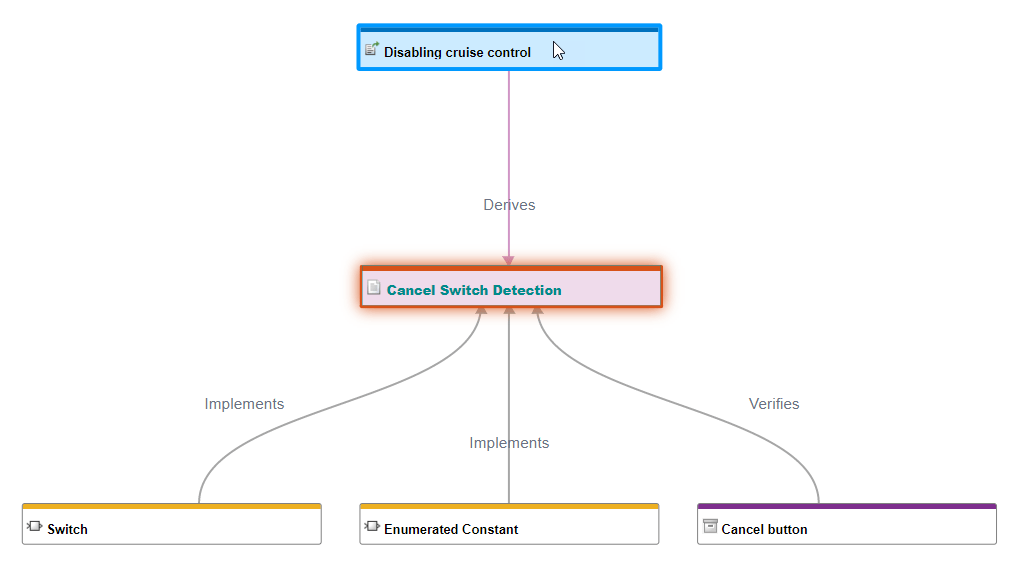
When you create a traceability diagram from a requirement, referenced requirement, justification, or link, the diagram is an item-level diagram. The nodes represent Model-Based Design items, such as requirements and Simulink blocks. The edges represent links between those items.
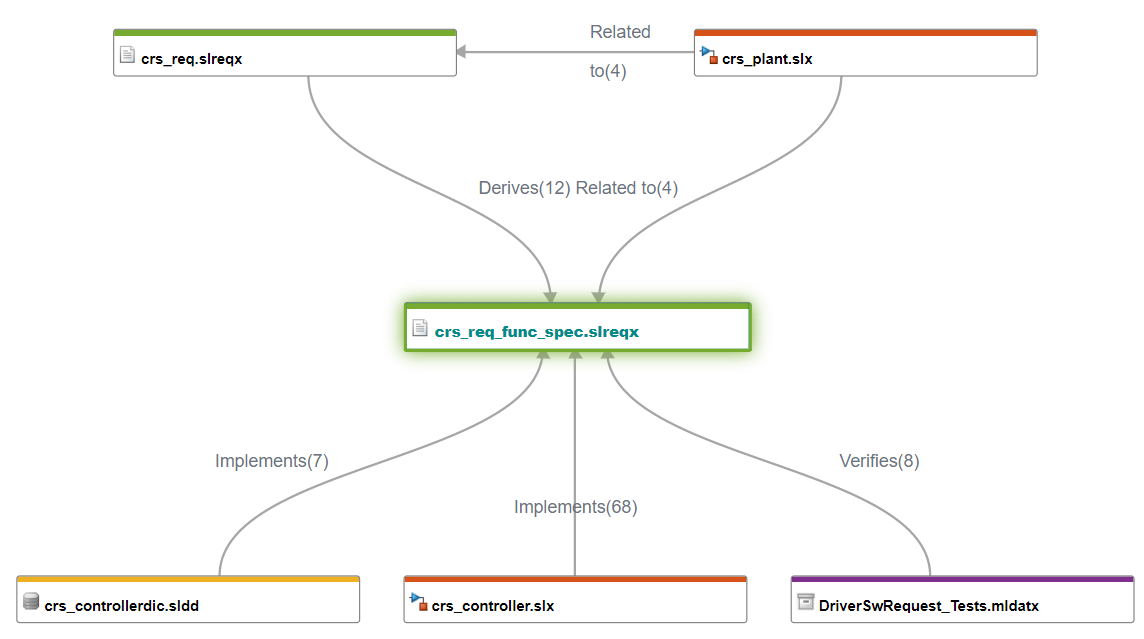
When you create a traceability diagram from a requirement set or link set, the diagram is an artifact-level diagram. The nodes represent Model-Based Design artifacts like requirement sets, Simulink models, and Simulink Test™ files. The edges represent links between items within the artifacts, such as links between requirements, Simulink blocks, and Simulink test cases.
Elements of a Diagram
Diagrams consist of nodes and edges.
Nodes represent Model-Based Design items or artifacts. The starting node of the diagram has blue text and a surrounding glow.
The node border color indicates the artifact that the node belongs to, or the artifact domain, such as Requirements Toolbox™ files, or Simulink models and libraries. The Legend pane displays the artifacts, the artifact colors, and the domain that each artifact belongs to.
For item-level diagrams, the warning icon () indicates an unavailable item. If the item is unavailable because it is not loaded, double-click the node. If the item is unavailable because the specified ID does not exist, then you must resolve the link. For more information, see Resolve Links.
Edges are arrows represent links between Model-Based Design items or items within artifacts. The label of the edge is the link type for item-level diagrams, and also includes the number of links of each type for artifact-level diagrams.
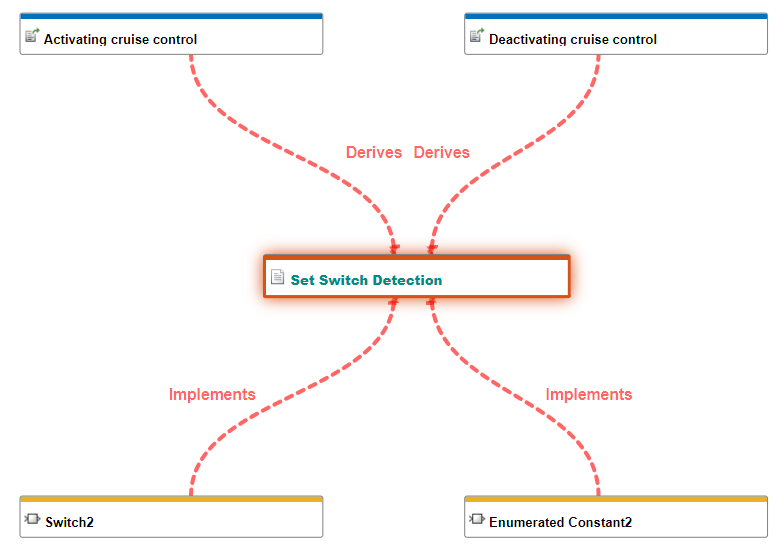
If a link has a change issue, the corresponding edge is a dashed red line. For more information about change issues, see Track Changes to Requirement Links.
The edge arrow points in the link direction, from the source node to the destination node. The link direction is not necessarily the same as the impact direction. For more information, see Impact Direction and Link Types.
Impact Direction
The link type relationship between the starting node and a link determines the impact direction of that edge. For more information, see Link Types. Upstream nodes impact the starting node, while downstream nodes are impacted by the starting node.
This table summarizes the relationship between the link type and the impact direction.
Link Type | Upstream | Relationship | Downstream | Impact direction |
---|---|---|---|---|
Relate | Source | Related to | Destination | Same as link direction |
Implement | Destination | Implemented by | Source | Opposite of link direction |
Verify | Destination | Verified by | Source | Opposite of link direction |
Derive | Source | Derives | Destination | Same as link direction |
Refine | Destination | Refined by | Source | Opposite of link direction |
Confirm | Source | Confirmed by | Destination | Same as link direction |
For example, if a link with the Implement
type
connects two nodes, then the destination is upstream and the source is downstream.
The impact direction is opposite of the link direction because the impact is from
the destination to the source.
You can use the impact direction to assess how changes propagate upstream and downstream. You can also use impact direction to assess requirements allocation. For more information, see Assess Allocation and Impact.
In an artifact-level diagram, if all links
between items in two artifacts have the same type, then the link type defines the
impact direction. If the links between items in two artifacts have different types,
but all types define the impact direction the same
way, they use the impact direction defined in the table. For example, both
Derive
and Relate
link types define the
source as upstream.
If the links between items in two artifacts have different types and the types define different impact directions, then the artifact containing the link source is defined as upstream, and the artifact containing the link destination is defined as downstream.
Use the Traceability Diagram
When you select a node, the diagram highlights the edges and nodes connected to the selected node.
Navigate from Node or Edge to Artifact
You can navigate from a node or edge to the corresponding item, artifact, link, or link set when you double-click the node or edge. You can also right-click the node or edge and select Navigate to. The node or edge opens in its respective artifact or domain.
Refresh the Diagram
If you create a traceability diagram and then make a change in the background to any of the items, artifacts, or links, you must refresh the diagram to apply the changes to the diagram. If you load an unloaded item or resolve a link, you must refresh the diagram to remove the warning icon (). For more information, see Elements of a Diagram.
Click Analyze to refresh the diagram.
Modify the Traceability Diagram View
You can modify the view in the Traceability Diagram window by using the toolstrip or the Legend and Overview panes.
Layout and Navigation
By default, the diagram is laid out vertically. You can change the layout by selecting Horizontal.
When you create a diagram, it fits to the work area. You can zoom in by clicking Zoom In or by pressing Ctrl+= or zoom out by clicking Zoom Out or pressing Ctrl+-. You can also use the scroll wheel to zoom. You can fit the diagram to the work area again by clicking Fit to View or pressing Space.
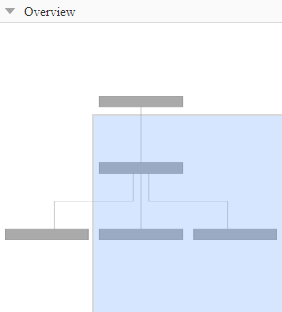
You can also navigate by using the Overview pane, which displays a map of the diagram. The map shows which area of the diagram you are currently viewing.
You can navigate to another area by clicking or dragging in the map. You can also navigate to another area of the diagram by pressing Ctrl and using a scroll wheel, or clicking and dragging with a scroll wheel.
Filter Nodes by Impact Direction
You can filter nodes from the diagram by impact direction. To only view nodes that are upstream from the starting node, click Upstream. To only view nodes that are downstream from the starting node, click Downstream.
To clear the upstream or downstream filter, click Show All Traceabilities.
Filter Nodes by Artifact or Domain
You can use the Legend pane to filter nodes from the diagram by artifact or artifact domain. To filter nodes from a particular artifact, clear the selection for that artifact. To filter nodes from a domain, clear the selection for that domain.
Note
For an artifact-level diagram, you can only filter by artifact domain.
Hide Edge Labels
By default, the diagram displays the link type as the label for each edge. You can hide the edge labels by right-clicking an edge or the white space in the diagram and clearing Always show labels on edges. After you clear the selection, the edge labels only appear when you select or point to an edge.
Export the Diagram
You can export the traceability diagram to a MATLAB
digraph
object. To export the diagram, in
the Traceability Diagram window, select Export > Export to MATLAB Variable. You can use digraph
object functions to work with the
object and plot
to visualize it.
You can use this code to create a figure that looks similar to the traceability
diagram. In this code, the variable graph_for_CancelSwitchDetection
is the name of the exported MATLAB
digraph
object.
dg = graph_for_CancelSwitchDetection; h = plot(dg,NodeLabel=dg.Nodes.Name,EdgeLabel=dg.Edges.Labels, ... YData=cell2mat(dg.Nodes.LayerDepths), ... XData=cell2mat(dg.Nodes.IndexInCurrentLayer), ... interpreter="none",hittest="on",ArrowSize=15,MarkerSize=10); nodeList = dg.Nodes.Name; for index = 1:length(nodeList) cNode = nodeList(index); if (dg.Nodes.isStartingNode{index}) h.highlight(cNode,NodeColor="b"); end end edgeList = dg.Edges.EndNodes; for index = 1:length(edgeList) if (dg.Edges.HasChanged{index}) h.highlight(edgeList{index,1},edgeList{index,2},EdgeColor="r"); end end
See Also
digraph
| slreq.generateTraceabilityDiagram