Logic Analyzer
Visualize, measure, and analyze transitions and states over time
Description
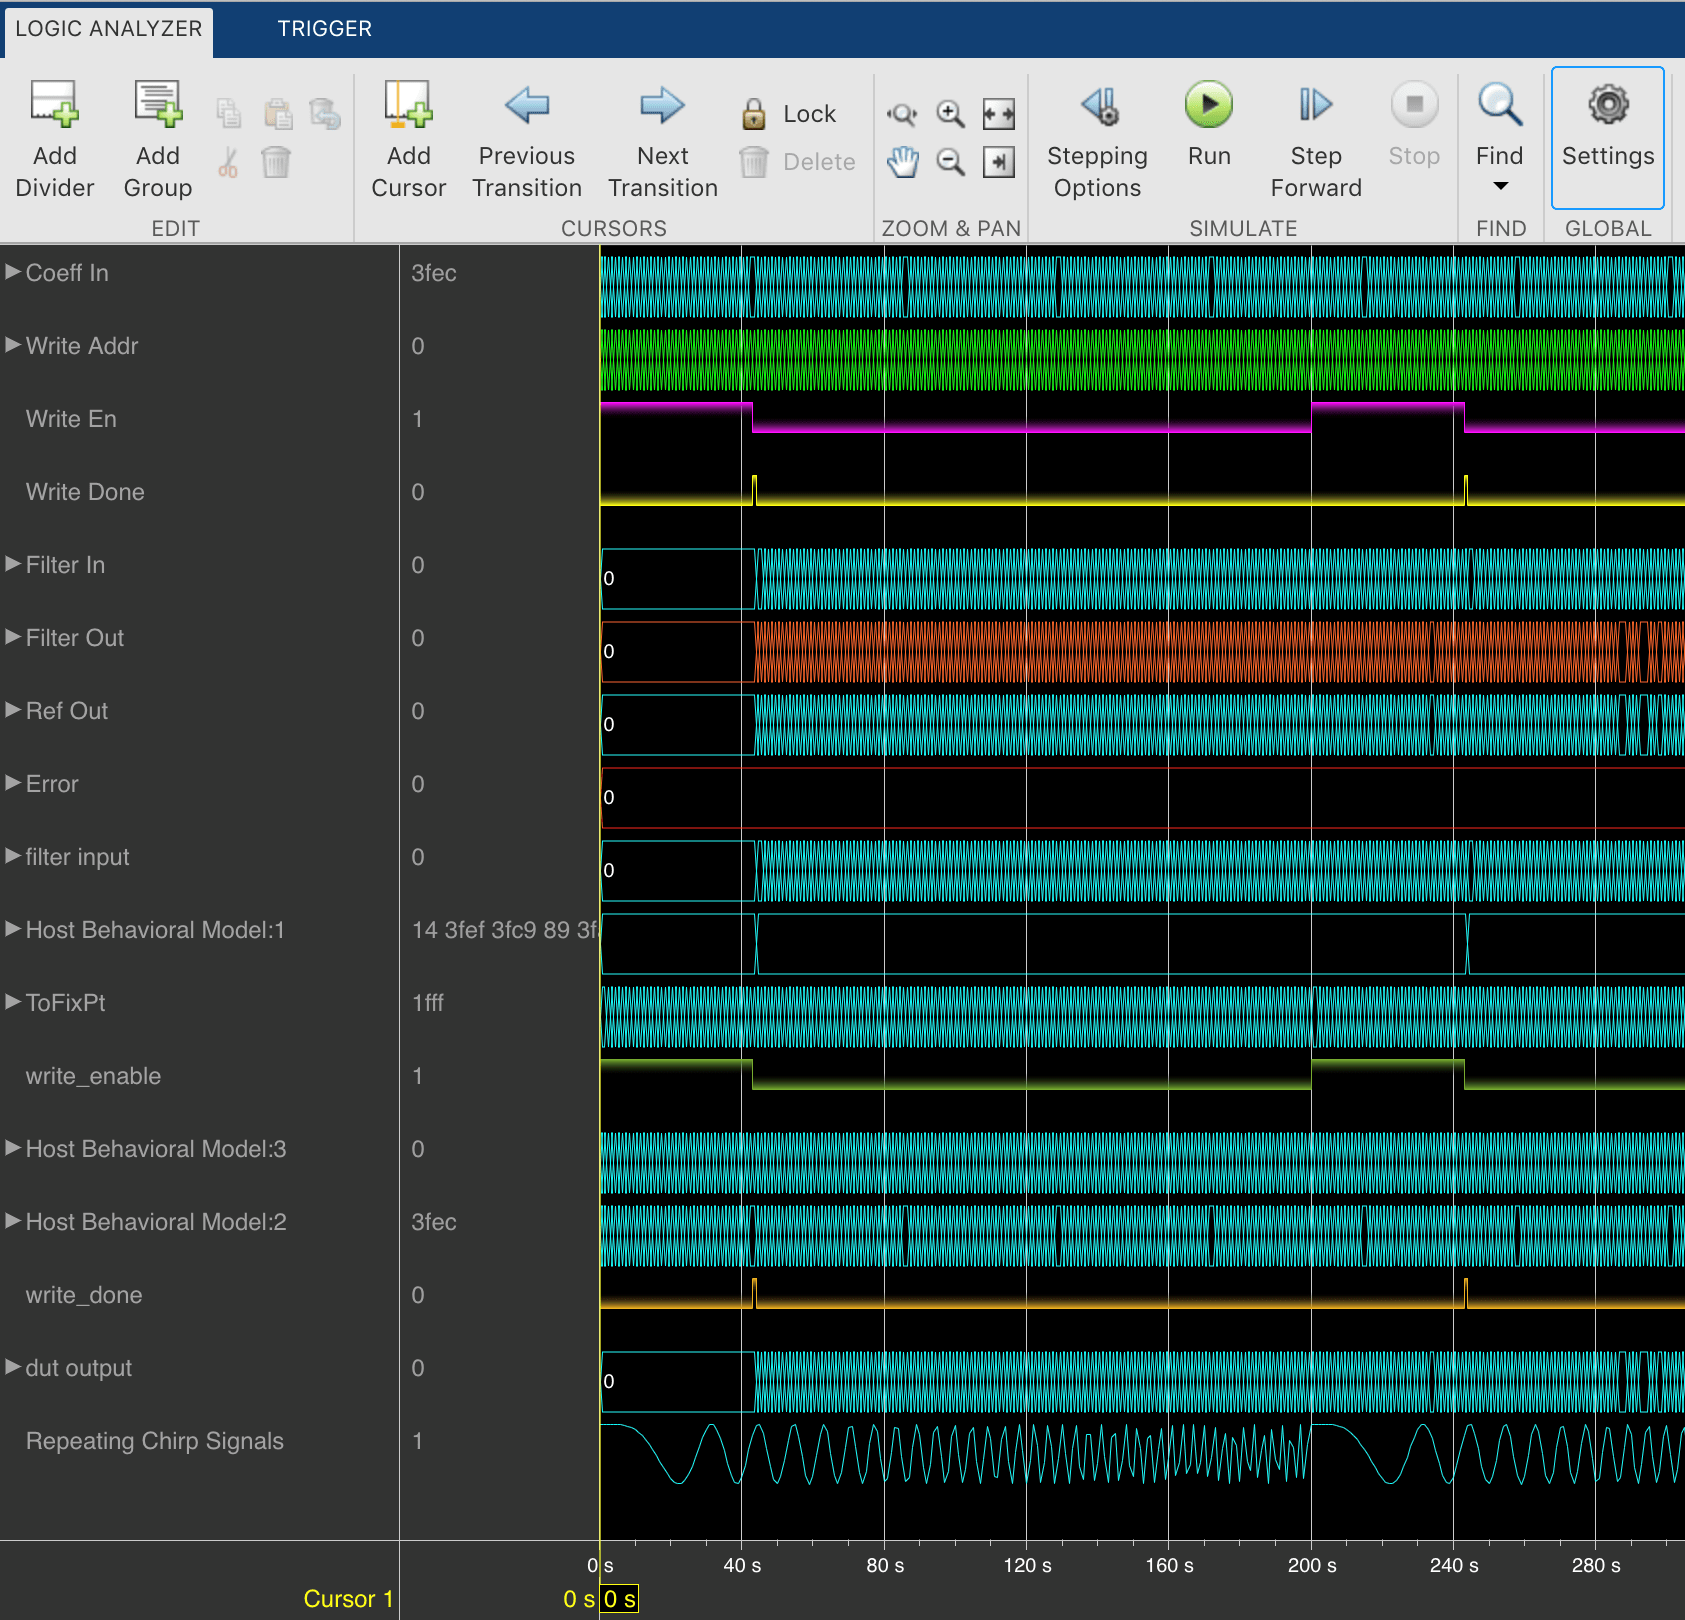
The Logic Analyzer is a tool for visualizing and inspecting signals and states in your Simulink® model. Using the Logic Analyzer, you can:
Debug and analyze models
Trace and correlate many signals simultaneously
Detect and analyze timing violations
Trace system execution
Detect signal changes using triggers
For keyboard shortcuts, click More.
Keyboard Shortcuts
| Actions | Description | Applicable When |
|---|---|---|
| Ctrl+S | Save view | Always |
| Ctrl+O | Open view | Always |
| Ctrl+X | Cut | Wave is selected |
| Ctrl+C | Copy | Wave is selected |
| Ctrl+V | Paste | Wave is selected |
| Delete | Delete | Wave is selected |
| Ctrl+- | Zoom out | Always |
| Shift+Ctrl+- | Zoom out around active cursor | Always |
| Ctrl++ | Zoom in | Always |
| Shift+Ctrl++ | Zoom out around active cursor | Always |
| Shift+Ctrl+C | Move display to active cursor | When cursor is not in the display range |
| Space | Zoom out full | Always |
| Tab, Right Arrow | Next transition | Digital format wave is selected |
| Shift+Tab, Left Arrow | Previous transition | Digital format wave is selected |
| Ctrl+A | Select all waves | Always |
| Up Arrow | Select wave above selected | Wave is selected |
| Down Arrow | Select wave below selection | Wave is selected |
| Ctrl+Up Arrow | Move selected waves up | Wave is selected |
| Ctrl+Down Arrow | Move selected waves down | Wave is selected |
| Escape | Unselect all signals | Wave is selected |
| Page Up | Scroll up | Always |
| Page Down | Scroll down | Always |
Open the Logic Analyzer App
On the Simulation tab in the Simulink Editor menu, click the Logic Analyzer app button. If the button is not displayed, expand the Review Results gallery and you will find the Logic Analyzer app under Signal Logging Results. Your most recent choice for data visualization is saved across Simulink sessions.
To visualize referenced models, you must open the Logic Analyzer from the referenced model. You should see the name of the referenced model in the Logic Analyzer toolbar.
Examples
Select Signals to Analyze
The Logic Analyzer supports several methods for selecting data to visualize.
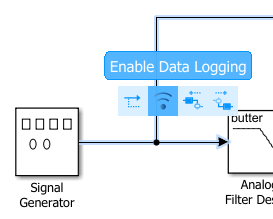
Select a signal in your model. When you select a signal, an ellipsis appears above the signal line. Hover over the ellipsis to view options and then select the Enable Data Logging option.
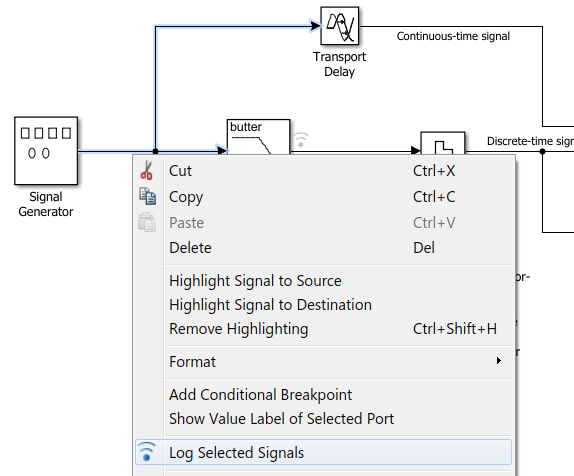
Right-click a signal in your model to open an options dialog box. Select the Log Selected Signals option.
Use any method to select multiple signal lines in your model. For example, use Shift+click to select multiple lines individually or CTRL+A to select all lines at once. Then, on the Signal tab, select the Log Signals button
 .
.
To visualize data in the Logic Analyzer, you must enable signal logging for the model. (Logging is on by default.) To enable signal logging, open Model Settings from the toolstrip, navigate to the Data Import/Export pane, and select Signal logging.
When you open the Logic Analyzer, all signals marked for logging are listed. You can add and delete waves from your Logic Analyzer while it is open. Adding and deleting signals does not disable logging, only removes the signal from the Logic Analyzer.
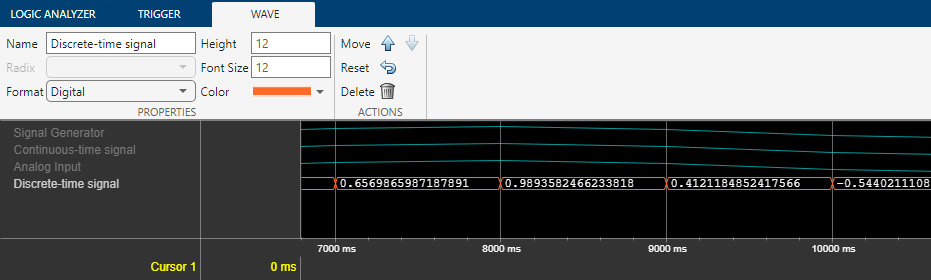
Modify Individual Wave Settings
Open the Logic Analyzer and select a wave by double-clicking the wave name. Then from the Wave tab, set parameters specific to the individual wave you selected. Any setting made on individual signals supersedes the global setting. To return individual wave parameters to the global settings, click Reset.
Delete and Restore Waves
Open the Logic Analyzer and select a wave by clicking the wave name.
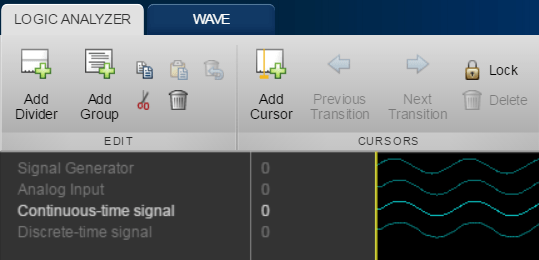
From the Logic Analyzer toolstrip, click
 . The wave is removed from the Logic
Analyzer.
. The wave is removed from the Logic
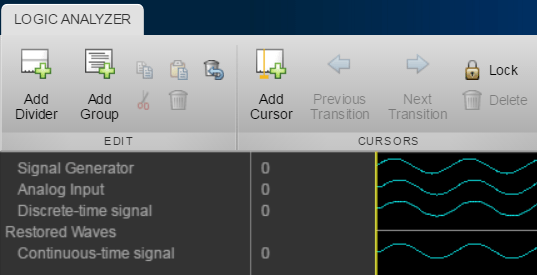
Analyzer.To restore the wave, from the Logic Analyzer toolstrip, click
 .
.A divider named Restored Waves is added to the bottom of your channels, with all deleted waves placed below it.
Save and Restore Views
You can save the current Logic Analyzer view as an MLDATX file and open it later. A Logic Analyzer view saves the signal layout and appearance characteristics without saving the data. Specifically, a view saves the signal names, signal groups, dividers, and their respective settings, including their order.
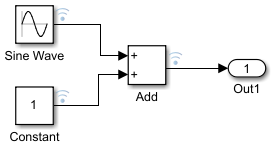
This example model contains Sine Wave and Constant blocks, whose outputs are connected to an Add block.

Save Logic Analyzer View
To save the current view, follow these steps:
In your model, select the signals that you want to visualize in the Logic Analyzer.
Log selected signals and open the Logic Analyzer app.
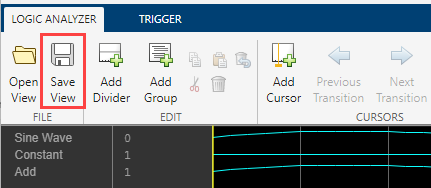
This example logs the output signals from the Sine Wave, Constant, and Add blocks.
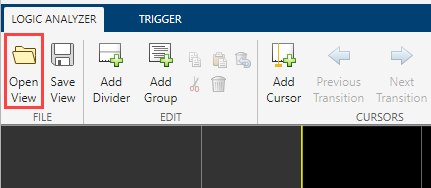
From the Logic Analyzer toolstrip, click Save View or press Ctrl+S.
In the window that opens, browse for the folder where you want to save the file. Then, name the file and click Save.

Open Logic Analyzer View
To open a saved view file, follow these steps:
Open the Logic Analyzer app.
From the Logic Analyzer toolstrip, click Open View or press Ctrl+O.
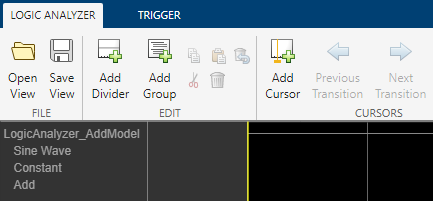
In the window that opens, browse for the folder where you saved the view file. Then, select the file and click Open. Logic Analyzer adds a divider named after the view file and the signals from the view file to the current view.
If you change a block or subsystem name in your Simulink model and open a saved Logic Analyzer view file, the file shows the updated signal names. For example, in the model in this example:
Change the name of the Sine Wave block to
Sine Signaland Constant block toConstant Signal.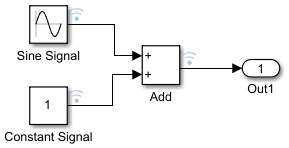
Compile or simulate your model and then open the saved view file. It shows the updated signal names.

Add Trigger
The Logic Analyzer trigger allows you to find data points based on certain conditions. This feature is useful for debugging or testing when you need to find a specific signal change.
Open the Logic Analyzer and select the Trigger tab.
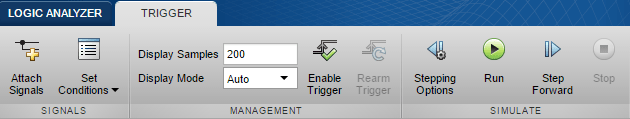
To attach a signal to the trigger, select Attach Signals, then select the signal you want to trigger on. You can attach up to 20 signals to the trigger. Each signal can have only one triggering condition.
By default, the trigger looks for rising edges in the attached signals. You can set the trigger to look for rising or falling edges, bit sequences, or a comparison value. To change the triggering conditions, select Set Conditions.
If you add multiple signals to the trigger, control the trigger logic using the Operator option:
AND- match all conditions.OR- match any condition.
To control how many samples you see before triggering, set the Display Samples option. For example, if you set this option to
500, the Logic Analyzer tries to give you 500 samples before the trigger. Depending on the simulation, the Logic Analyzer may show more or fewer than 500 samples before the trigger. However, if the trigger is found before the 500th sample, the Logic Analyzer still shows the trigger.Control the trigger mode using Display Mode.
Once- The Logic Analyzer marks only the first location matching the trigger conditions and stops showing updates to the Logic Analyzer. If you want to reset the trigger, select Rearm Trigger. Relative to the current simulation time, the Logic Analyzer shows the next matching trigger event.Auto- The Logic Analyzer marks every location matching the trigger conditions.
Before running the simulation, select Enable Trigger. A blue cursor appears as time 0. Then, run the simulation. When a trigger is found, the Logic Analyzer marks the location with a locked blue cursor.
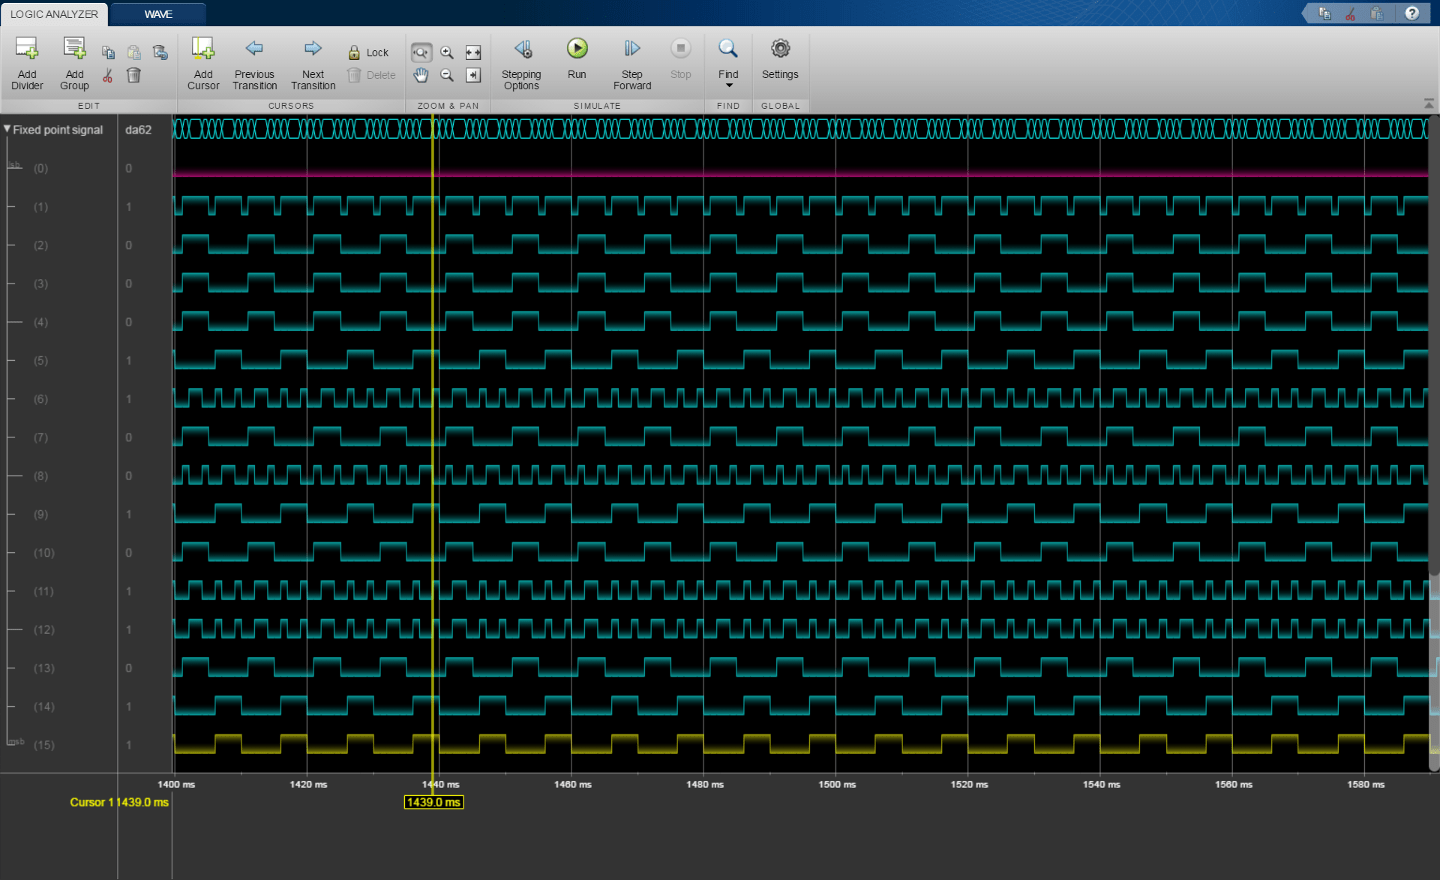
View Bit-Expanded Wave and Reverse Display Order of Bits
The Logic Analyzer enables you to bit-expand fixed-point and integer waves.
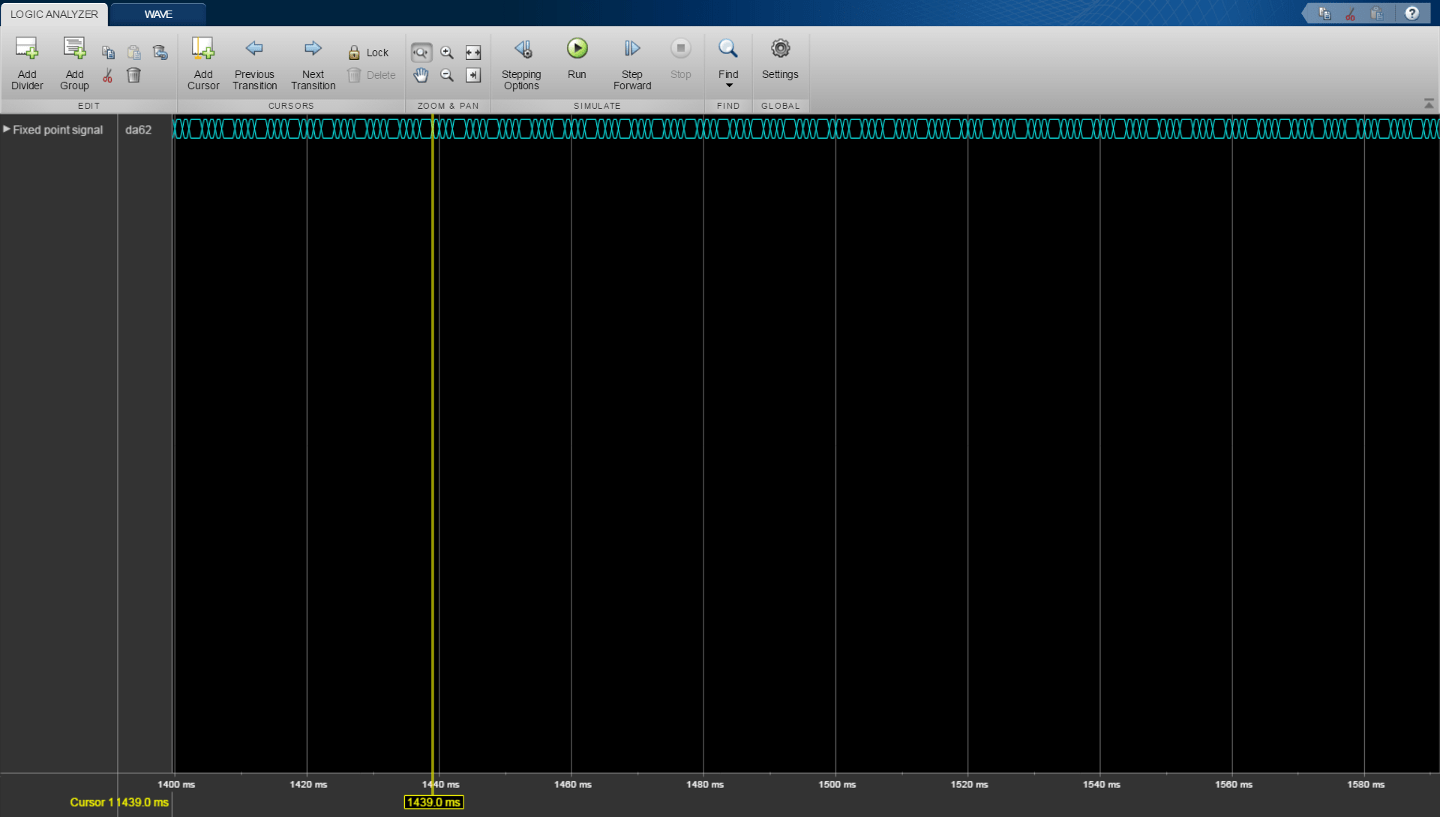
In the Logic Analyzer, click the arrow next to a fixed-point or integer wave to view the bits.
The least significant bit and the most significant bit are marked with lsb and msb next to the wave names.
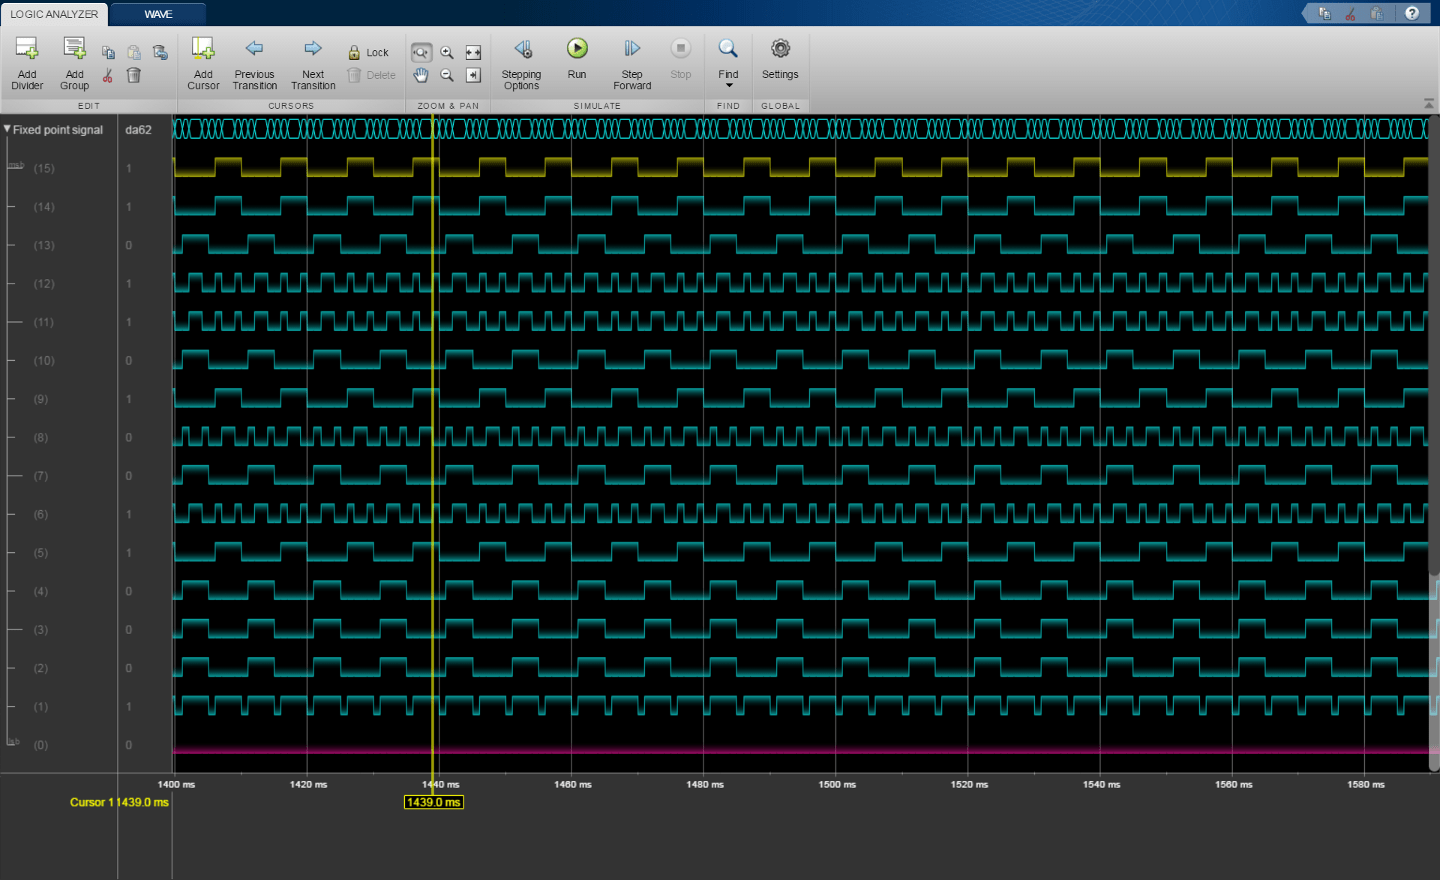
Click Settings, and then select Display Least Significant bit first to reverse the order of the displayed bits.
View Stateflow States in Logic Analyzer
Use the Logic Analyzer to visualize and measure transitions and states over time. With the Logic Analyzer, you can visualize:
Output data from your chart
Child and leaf state activity for your chart
Self, child, and leaf state activity for your states
You can measure the output over time and add triggers to identify the output values at specified events.
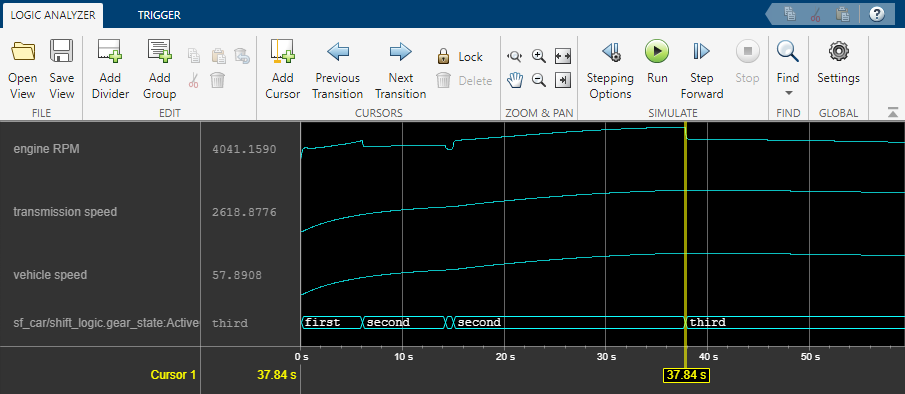
Add Signals and States for Logging
In this example, you use the Logic Analyzer to visualize the
behavior of the engine RPM, the transmission and vehicle speed, and the gear
state in the model sf_car.
Open the model
sf_car.openExample("sf_car")
In the Simulink Editor, click the
engine RPMsignal. Then, in the Simulation tab, select Log Signals.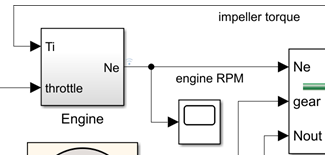
The logging badge
 appears above the signal to indicate that
the data from the signal is logged when you run the model.
appears above the signal to indicate that
the data from the signal is logged when you run the model.Repeat the previous step for the
transmission speedandvehicle speedsignals.Open the
shift_logicchart by clicking the arrow in the bottom-left corner of the block.
Select the state
gear_state. Then, in the Simulation tab, click Log Child Activity. The logging badge appears in the corner of the
state.
View Logged Output in Logic Analyzer
Simulate the model.
In the Simulation tab, under Review Results, select Logic Analyzer
 . When you simulate the model, the icon is
highlighted to indicate that the Logic Analyzer has new
simulation data.
. When you simulate the model, the icon is
highlighted to indicate that the Logic Analyzer has new
simulation data.In the Logic Analyzer window, drag the yellow cursor to see the signal values at different points in the simulation. For example, you can see the reaction of the engine RPM as the car gears change. For more information, see Inspect and Measure Transitions Using the Logic Analyzer (DSP System Toolbox).
Related Examples
- Programmable FIR Filter for FPGA (HDL Coder)
- Packet-Based ADS-B Transceiver
- Log Simulation Output for States and Data (Stateflow)
Limitations
Logging Settings
If you enable the configuration parameter Log data to file, you cannot stream logged data to the Logic Analyzer.
Signals marked for logging using
Simulink.sdi.markSignalForStreamingor visualized with a Dashboard Scope do not appear on the Logic Analyzer.You cannot visualize Data Store Memory block signals in the Logic Analyzer if you set the Log data store data parameter to on.
Input Signal Limitations
Signals marked for logging for the Logic Analyzer must have fewer than 8000 samples per simulation step.
The Logic Analyzer does not support frame-based processing.
For 64-bit integers and fixed-point numbers greater than 53 bits, if the numbers are greater than the maximum value of double precision, the transitions between numbers might not display correctly. To verify results, enable signal logging, or use a Display block.
You may see performance degradation in the Logic Analyzer for large matrices (greater than 500 elements) and buses with more than 1000 signals.
The Logic Analyzer app does not support Stateflow® data output.
The Logic Analyzer app does not display any waveform for
InfandNaNvalues.
Graphical Settings
While the simulation is running, you cannot zoom, pan, or modify the trigger.
To visualize constant signals, in the settings, you must set the Format to
Digital. Constants marked for logging are visualized as a continuous transition.
| Mode | Supported | Notes and Limitations |
|---|---|---|
Normal | Yes | |
Accelerator | Yes | You cannot use the Logic Analyzer to visualize
signals in Model blocks
with Simulation mode set to
|
Rapid Accelerator | Yes | Data is not available in the Logic Analyzer during simulation. If you simulate a model with the simulation mode set to rapid accelerator, after simulation the following signals cannot be visualized in the Logic Analyzer:
|
Processor-in-the-loop (PIL) | No | |
Software-in-the-loop (SIL) | No | |
External | No |
For more information about these modes, see How Acceleration Modes Work.
Version History
Introduced in R2016b