Generate Derived Data Sheets
You can use built-in MATLAB® scripts to generate derived data sheets for specific blocks. Derived data sheets contain summary tables and characteristic plots based on the block parameter values in your model. These tables and plots are similar to those that device manufacturers provide in their data sheets. Use derived data sheets to:
Explore the impact of your parameter choices on device characteristics.
Confirm that the block behaves as you expect, if you parameterized the block to match the manufacturer specifications of a specific part.
Help you choose a part from a manufacturer, if you tuned the block parameter values so that your Simscape™ model satisfies your system-level design requirements.
Communicate your design to other members of your organization.
To generate a derived data sheet:
Open the MATLAB script by clicking the Open live script button next to the Derived data sheet parameter in the Utilities section of the block dialog box.
In the script that opens, provide values for any additional variables that the data sheet requires.
For example, the derived data sheet for the PMSM block contains this code block under the Enter Parameter Values heading. You can specify a new value for the peak line current in amps by replacing the numerical value,
30, in the Peak of line current (A) text box.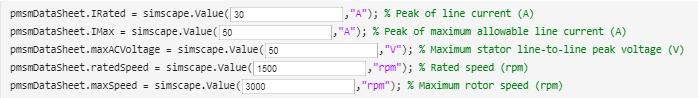
Click the Generate Data Sheet button in the script.
Depending on the block, MATLAB either:
Calculates the characteristics by substituting your block parameter values into the defining equations.
Simulates a harness with a copy of your block in Simulink® over a range of conditions, then imports the results to MATLAB.
The script then generates a specification table and plots the results. For example, the derived data sheet for the PMSM block with default parameter values contains this table under the Generate Specification Tables heading.
Parameter Value Unit
Continuous Stall Torque 2.31 Nm
Peak Torque 7.10 Nm
Rated Speed 1800.00 rpm
Peak of Stall Current 10.56 A
Peak of Maximum Current 31.68 A
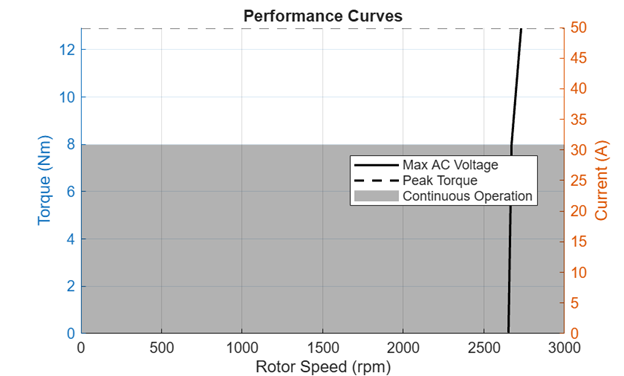
Rated Power 0.44 kW The derived data sheet for the PMSM block also contains:
A plot that shows torque and current versus rotor speed at both peak torque and maximum AC voltage
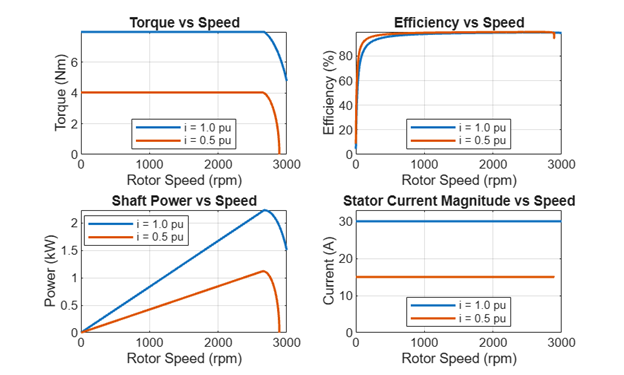
Subplots of torque, efficiency, shaft power, and stator current versus rotor speed at 50% and 100% of the rated stator current
You can compare these plots and summary tables to manufacturer data sheets, either to check that you have parameterized the block correctly or to help you select a manufactured part.
MATLAB stores the data displayed in the summary table and plots, as a structure in
the workspace. The structure for the PMSM block is named pmsmDataSheet.
You can use this structure to postprocess the data.
To compare plots and summary tables for devices with different characteristics:
Save the results by renaming the structure so that MATLAB does not replace it with new results when you regenerate the data sheet.
Change the input variables in the top section of the MATLAB script or the parameter values in the block mask.
Click the Generate Data Sheet button or run the MATLAB script again.
The block you generate the data sheet for must be the currently selected block in your Simulink model. If you make changes to your model, click the block before regenerating the data sheet.
Blocks That Support Derived Data Sheets
This table shows the blocks that support derived data sheets in the Simscape Electrical™ sublibraries.
If you want to generate summary tables and characteristics plots of block-level characteristics, but your block does not support derived data sheets, you can use Display or Plot buttons, respectively, in the Utilities section of the block parameters. For more information, see Visualize Block Parameterization by Plotting Characteristic Curves.
If your block does not support Utilities, or if the buttons do not generate the plots and summary information you need, you can build your own harness. To learn how to build harnesses and plot block-level characteristics, see the featured examples in the Visualize, Validate, and Tune Parameter Values category.
| Block | Additional Input Variables | Derivation | Specification Table | Plots | Additional Information |
|---|---|---|---|---|---|
| BLDC |
| Harness |
|
| |
| Induction Machine Squirrel Cage | None | Harness |
|
| You can plot characteristics for wye, delta, or both winding
configurations by selecting a value for the
WindingConfiguration dropdown list in the
script. |
| Magnetic Core | None | Harness |
|
|
|
| MOSFET (Ideal, Switching) | None | Defining equations |
To include these additional variables in the
specification table, in the block dialog box, set the
Modeling option parameter to
|
|
|
| PMSM |
| Defining equations |
|
|
|
| Solar Cell | None | Harness |
|
|
|
See Also
Simscape Blocks
- BLDC | Induction Machine Squirrel Cage | Magnetic Core | MOSFET (Ideal, Switching) | PMSM | Solar Cell