convertToSTT
说明
示例
此示例说明如何将 Stateflow® 图转换为状态转移表。
打开示例模型并访问 Stateflow.Chart 对象。
open_system("sf_aircontrol")
chart = find(sfroot,"-isa","Stateflow.Chart");
view(chart)
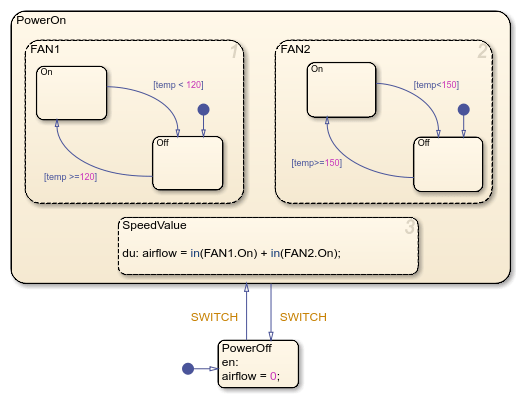
将图转换为状态转移表。
table = convertToSTT(chart);
view(table)
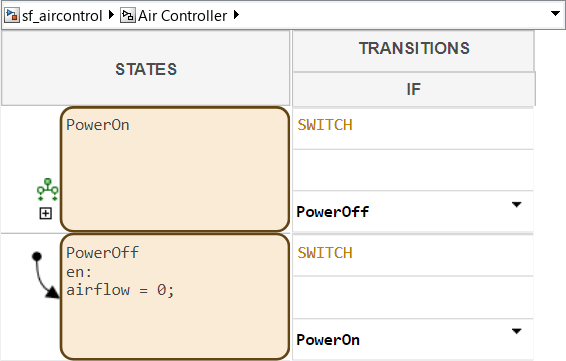
要显示状态 Power_On 的子状态,请点击状态左侧的 ![]() 按钮。
按钮。

输入参数
限制
不支持包含超转移的图。
图必须位于 Simulink® 模型的顶层。
图不能包含变体转移。
版本历史记录
在 R2023b 中推出