Debug a MATLAB Function in a Chart
Check MATLAB Functions for Syntax Errors
Before you can build a simulation application for a model, you must fix syntax errors.
Follow these steps to check the MATLAB® function meanstats for syntax violations:
Open the function
meanstatsinside the chart in thecall_stats_function_stateflowmodel that you constructed in Integrate MATLAB Functions in Stateflow Charts.The editor automatically checks your function code for errors and recommends corrections.
In the Apps tab, click Simulink Coder. In the C Code tab, click Build.
If there are no errors or warnings, the Builder window appears and reports success. Otherwise, it lists errors. For example, if you change the name of local function
avgto a nonexistent local functionauginmeanstats, errors appear in the Diagnostic Viewer.The diagnostic message provides details of the type of error and a link to the code where the error occurred. The diagnostic message also contains a link to a diagnostic report that provides links to your MATLAB functions and compile-time type information for the variables and expressions in these functions. If your model fails to build, this information simplifies finding sources of error messages and aids understanding of type propagation rules. For more information about this report, see MATLAB Function Reports (Simulink).
In the diagnostic message, click the link after the function name
meanstatsto display the offending line of code.The offending line appears highlighted in the editor.
Correct the error by changing
augback toavgand recompile. No errors are found and the compile completes successfully.
Run-Time Debugging for MATLAB Functions in Charts
You use simulation to test your MATLAB functions for run-time errors that are not detectable by Stateflow®. When you simulate your model, your MATLAB functions undergo diagnostic tests for missing or undefined information and possible logical conflicts as described in Check MATLAB Functions for Syntax Errors. If no errors are found, the simulation of your model begins.
Follow these steps to simulate and debug the meanstats function
during run-time conditions:
In the function editor, click the line number of this line:
len = length(vals);
The line number is highlighted in red, indicating that you have set a breakpoint.
Start simulation for the model.
If you get any errors or warnings, make corrections before you try to simulate again. Otherwise, simulation pauses when execution reaches the breakpoint you set. The line of code is highlighted, indicating this pause.
To advance execution to the next line, select Step Over.
Notice that this line calls the local function
avg. If you select Step Over here, execution advances past the execution of the local functionavg. To track execution of the lines in the local functionavg, select Step In instead.To advance execution to the first line of the called local function
avg, select Step In.Once you are in the local function, you can advance through one line at a time with the Step Over tool. If the local function calls another local function, use the Step In tool to step into it. To continue through the remaining lines of the local function and go back to the line after the local function call, select Step Out.
Select Step Over to execute the only line in
avg.Select Step Over to return to the function
meanstats.Execution advances to the line after the call to
avg.To display the value of the variable
len, point to the textlenin the function editor for at least a second.The value of
lenappears adjacent to your pointer.You can display the value for any data in the MATLAB function in this way, no matter where it appears in the function. For example, you can display the values for the vector
valsby placing your pointer over it as an argument to the functionlength, or as an argument in the function header.You can also report the values for MATLAB function data in the MATLAB Command Window during simulation. When you reach a breakpoint, the
debug>>command prompt appears in the MATLAB Command Window (you may have to press Enter to see it). At this prompt, you can inspect data defined for the function by entering the name of the data, as shown in this example:debug>> len
len =
     4
As another debugging alternative, you can display the execution result of a function line by omitting the terminating semicolon. If you do, execution results appear in the MATLAB Command Window during simulation.
To leave the function until it is called again and the breakpoint is reached, select Continue.
At any point in a function, you can advance through the execution of the remaining lines of the function with the Continue tool. If you are at the end of the function, selecting Step Over completes the same action.
Click the breakpoint to remove it and click Stop to complete the simulation.
In the model, the computed values of
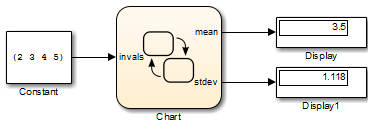
meanandstdevnow appear in the Display blocks.
Check for Data Range Violations
To control the level of diagnostic action for data range violations, open the
Configuration Parameters dialog box and, in the Diagnostics > Data Validity pane, set the Simulation range checking parameter to
none, warning, or
error. The default setting is none.
For more information, see Simulation range checking (Simulink).
Specify a Range
To specify a range for input and output data, follow these steps:
In the Model Explorer, select the MATLAB function input or output of interest.
The Data properties dialog box opens in the Dialog pane of the Model Explorer.
In the Data properties dialog box, click the General tab and enter a limit range, as described in Limit range.