edge
Classification edge for generalized additive model (GAM)
Description
e = edge(Mdl,Tbl,ResponseVarName)e)
for the generalized additive model Mdl using the predictor data in
Tbl and the true class labels in
Tbl.ResponseVarName.
e = edge(___,Name,Value)
Examples
Estimate the test sample classification margins and edge of a generalized additive model. The test sample margins are the observed true class scores minus the false class scores, and the test sample edge is the mean of the margins.
Load the fisheriris data set. Create X as a numeric matrix that contains two sepal and two petal measurements for versicolor and virginica irises. Create Y as a cell array of character vectors that contains the corresponding iris species.
load fisheriris
inds = strcmp(species,'versicolor') | strcmp(species,'virginica');
X = meas(inds,:);
Y = species(inds,:);
Randomly partition observations into a training set and a test set with stratification, using the class information in Y. Specify a 30% holdout sample for testing.
rng('default') % For reproducibility
cv = cvpartition(Y,'HoldOut',0.30);
Extract the training and test indices.
trainInds = training(cv);
testInds = test(cv);
Specify the training and test data sets.
XTrain = X(trainInds,:);
YTrain = Y(trainInds);
XTest = X(testInds,:);
YTest = Y(testInds);
Train a GAM using the predictors XTrain and class labels YTrain. A recommended practice is to specify the class names.
Mdl = fitcgam(XTrain,YTrain,'ClassNames',{'versicolor','virginica'});
Mdl is a ClassificationGAM model object.
Estimate the test sample classification margins and edge.
m = margin(Mdl,XTest,YTest);
e = edge(Mdl,XTest,YTest)
e =
0.8000
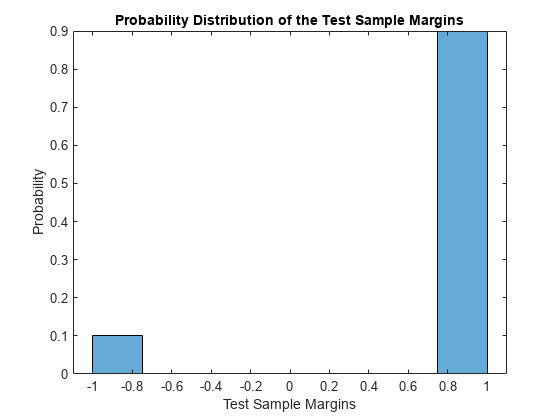
Display the histogram of the test sample classification margins.
histogram(m,length(unique(m)),'Normalization','probability')
xlabel('Test Sample Margins')
ylabel('Probability')
title('Probability Distribution of the Test Sample Margins')
Estimate the test sample weighted edge (the weighted average of margins) of a generalized additive model.
Load the fisheriris data set. Create X as a numeric matrix that contains two sepal and two petal measurements for versicolor and virginica irises. Create Y as a cell array of character vectors that contains the corresponding iris species.
load fisheriris
idx1 = strcmp(species,'versicolor') | strcmp(species,'virginica');
X = meas(idx1,:);
Y = species(idx1,:);
Suppose that the quality of some measurements is lower because they were measured with older technology. To simulate this effect, add noise to a random subset of 20 measurements.
rng('default') % For reproducibility
idx2 = randperm(size(X,1),20);
X(idx2,:) = X(idx2,:) + 2*randn(20,size(X,2));
Randomly partition observations into a training set and a test set with stratification, using the class information in Y. Specify a 30% holdout sample for testing.
cv = cvpartition(Y,'HoldOut',0.30);Extract the training and test indices.
trainInds = training(cv);
testInds = test(cv);
Specify the training and test data sets.
XTrain = X(trainInds,:);
YTrain = Y(trainInds);
XTest = X(testInds,:);
YTest = Y(testInds);
Train a GAM using the predictors XTrain and class labels YTrain. A recommended practice is to specify the class names.
Mdl = fitcgam(XTrain,YTrain,'ClassNames',{'versicolor','virginica'});
Mdl is a ClassificationGAM model object.
Estimate the test sample edge.
e = edge(Mdl,XTest,YTest)
e =
0.8000
The average margin is approximately 0.80.
One way to reduce the effect of the noisy measurements is to assign them less weight than the other observations. Define a weight vector that gives the higher quality observations twice the weight of the other observations.
n = size(X,1);
weights = ones(size(X,1),1);
weights(idx2) = 0.5;
weightsTrain = weights(trainInds);
weightsTest = weights(testInds);
Train a GAM using the predictors XTrain, class labels YTrain, and weights weightsTrain.
Mdl_W = fitcgam(XTrain,YTrain,'Weights',weightsTrain,...
    'ClassNames',{'versicolor','virginica'});
Estimate the test sample weighted edge using the weighting scheme.
e_W = edge(Mdl_W,XTest,YTest,'Weights',weightsTest)e_W = 0.8770
The weighted average margin is approximately 0.88. This result indicates that, on average, the labels from weighted classifier labels have higher confidence.
Compare a GAM with linear terms to a GAM with both linear and interaction terms by examining the test sample margins and edge. Based solely on this comparison, the classifier with the highest margins and edge is the best model.
Load the ionosphere data set. This data set has 34 predictors and 351 binary responses for radar returns, either bad ('b') or good ('g').
load ionosphereRandomly partition observations into a training set and a test set with stratification, using the class information in Y. Specify a 30% holdout sample for testing.
rng('default') % For reproducibility
cv = cvpartition(Y,'Holdout',0.30);
Extract the training and test indices.
trainInds = training(cv);
testInds = test(cv);
Specify the training and test data sets.
XTrain = X(trainInds,:);
YTrain = Y(trainInds);
XTest = X(testInds,:);
YTest = Y(testInds);
Train a GAM that contains both linear and interaction terms for predictors. Specify to include all available interaction terms whose p-values are not greater than 0.05.
Mdl = fitcgam(XTrain,YTrain,'Interactions','all','MaxPValue',0.05)
Mdl =
  ClassificationGAM
             ResponseName: 'Y'
    CategoricalPredictors: []
               ClassNames: {'b'  'g'}
           ScoreTransform: 'logit'
                Intercept: 3.0398
             Interactions: [561×2 double]
          NumObservations: 246


  Properties, Methods
Mdl is a ClassificationGAM model object. Mdl includes all available interaction terms.
Estimate the test sample margins and edge for Mdl.
M = margin(Mdl,XTest,YTest);
E = edge(Mdl,XTest,YTest)
E =
0.7848
Estimate the test sample margins and edge for Mdl without including interaction terms.
M_nointeractions = margin(Mdl,XTest,YTest,'IncludeInteractions',false);
E_nointeractions = edge(Mdl,XTest,YTest,'IncludeInteractions',false)
E_nointeractions =
0.7871
Display the distributions of the margins using box plots.
boxplot([M M_nointeractions],'Labels',{'Linear and Interaction Terms','Linear Terms Only'})
title('Box Plots of Test Sample Margins')
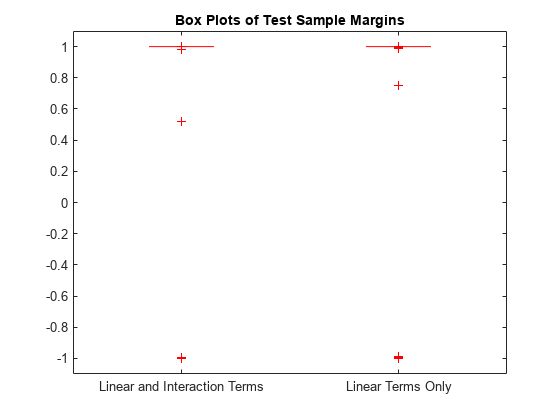
The margins M and M_nointeractions have a similar distribution, but the test sample edge of the classifier with only linear terms is larger. Classifiers that yield relatively large margins are preferred.
Input Arguments
Name-Value Arguments
More About
Version History
Introduced in R2021a