plot
Plot clustering evaluation object criterion values
Description
plot( displays a plot of the
criterion values versus the number of clusters, based on the values in the clustering
evaluation object evaluation)evaluation.
plot( plots
into the axes specified by ax,evaluation)ax instead of the current axes (gca). (since R2024a)
h = plot(___)Line object using any of the input argument combinations in the previous
syntaxes. Use this object to inspect and adjust the properties of the plot line. For a list
of properties, see Line Properties.
Examples
Plot the criterion values versus the number of clusters for each clustering solution stored in a clustering evaluation object.
Load the fisheriris data set. The data contains length and width measurements from the sepals and petals of three species of iris flowers.
load fisheririsCreate a clustering evaluation object. Cluster the data using kmeans, and evaluate the optimal number of clusters using the Calinski-Harabasz criterion.
rng("default") % For reproducibility
evaluation = evalclusters(meas,"kmeans","CalinskiHarabasz","KList",1:6);
Plot the Calinski-Harabasz criterion values for each number of clusters tested.
plot(evaluation)
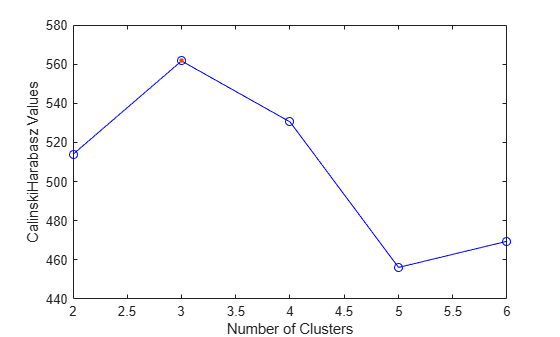
The plot shows that the highest Calinski-Harabasz value occurs at three clusters, suggesting that the optimal number of clusters is three.
Cluster data using each of the four clustering evaluation criteria. For each criterion, create a plot of the criterion values and indicate the optimal number of clusters.
Generate sample data containing random numbers from three multivariate distributions with different parameter values.
rng("default") % For reproducibility
n = 200;

mu1 = [2 2];
sigma1 = [0.9 -0.0255; -0.0255 0.9];

mu2 = [5 5];
sigma2 = [0.5 0; 0 0.3];

mu3 = [-2 -2];
sigma3 = [1 0; 0 0.9];

X = [mvnrnd(mu1,sigma1,n); ...
     mvnrnd(mu2,sigma2,n); ...
     mvnrnd(mu3,sigma3,n)];
Cluster the data using kmeans, and evaluate the optimal number of clusters using the Calinski-Harabasz, Davies-Bouldin, gap, and silhouette criteria.
calinskiEvaluation = evalclusters(X,"kmeans","CalinskiHarabasz", ...
    "KList",1:6);
daviesEvaluation = evalclusters(X,"kmeans","DaviesBouldin", ...
    "KList",1:6);
gapEvaluation = evalclusters(X,"kmeans","gap","KList",1:6);
silhouetteEvaluation = evalclusters(X,"kmeans","silhouette", ...
    "KList",1:6);
For each clustering evaluation object, plot the criterion values for the number of proposed clusters. In each plot, change the color of the plot line and add a vertical line indicating the optimal number of clusters.
t = tiledlayout(2,2);
title(t,"Optimal Number of Clusters for Different Criteria")
colors = lines(4);

% Calinski-Harabasz Criterion Plot
nexttile
h1 = plot(calinskiEvaluation);
h1.Color = colors(1,:);
hold on
xline(calinskiEvaluation.OptimalK,"--","Optimal K", ...
    "LabelVerticalAlignment","middle")
hold off

% Davies-Bouldin Criterion Plot
nexttile
h2 = plot(daviesEvaluation);
h2.Color = colors(2,:);
hold on
xline(daviesEvaluation.OptimalK,"--","Optimal K", ...
    "LabelVerticalAlignment","middle")
hold off

% Gap Criterion Plot
nexttile
h3 = plot(gapEvaluation);
h3.Color = colors(3,:);
hold on
xline(gapEvaluation.OptimalK,"--","Optimal K", ...
    "LabelVerticalAlignment","middle")
hold off

% Silhouette Criterion Plot
nexttile
h4 = plot(silhouetteEvaluation);
h4.Color = colors(4,:);
hold on
xline(silhouetteEvaluation.OptimalK,"--","Optimal K", ...
    "LabelVerticalAlignment","middle")
hold off
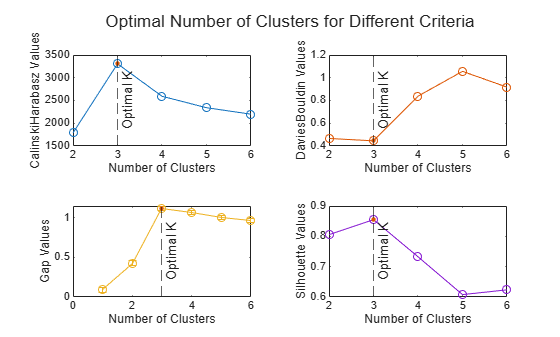
The four plots indicate that the optimal number of clusters is three, regardless of the clustering criterion.