polyconf
R2026bPolynomial confidence intervals
Description
[___] = polyconf(___,Name=Value) specifies
options using one or more name-value arguments in addition to one of the previous syntaxes.
For example, you can specify the confidence level for the confidence bounds.
Examples
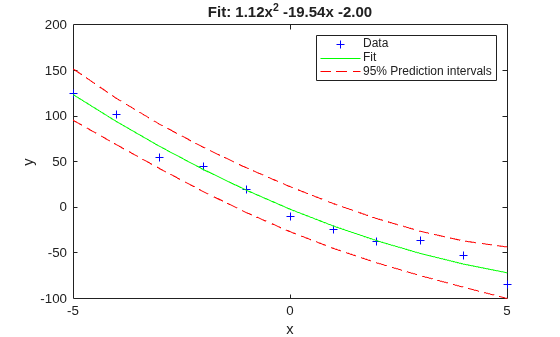
Fit a polynomial to a sample data set, and estimate the 95% prediction intervals and the roots of the fitted polynomial. Plot the data and the estimations, and display the fitted polynomial expression.
Generate sample data points (x,y) with a quadratic trend.
rng(0,"twister") % For reproducibility
x = -5:5;
y = x.^2 - 20*x - 3 + 5*randn(size(x));
Fit a second-degree polynomial to the data by using the polyfit function.
degree = 2;
[p,S] = polyfit(x,y,degree);
Estimate the 95% prediction intervals by using polyconf.
alpha = 0.05; % Significance level
[yfit,Delta] = polyconf(p,x,S,Alpha=alpha);
Plot the data, fitted polynomial, and prediction intervals, and display the fitted polynomial expression.
plot(x,y,"b+")
hold on
plot(x,yfit,"g-")
plot(x,yfit-Delta,"r--",x,yfit+Delta,"r--")
xlabel("x")
ylabel("y")
legend("Data","Fit","95% Prediction intervals")
title(["Fit: "+ sprintf("%.2fx^2 %+ .2fx %+ .2f",p(1),p(2),p(3))])
hold off
Find the roots of the polynomial p.
r = roots(p)
r = 2×1

   17.5152
   -0.1017
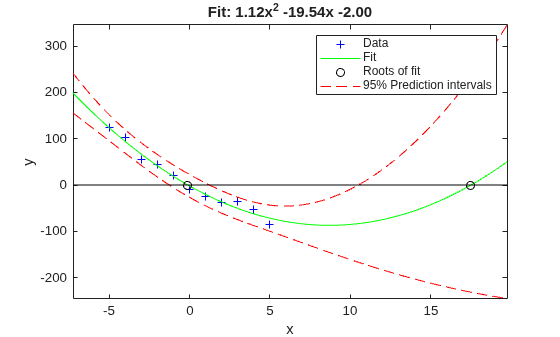
Because the roots are real values, you can plot them as well. Estimate the fitted values and prediction intervals for the x interval that includes the roots. Then, plot the roots and the estimations.
xmin = min([r(:);x(:)]);
xrange = range([r(:);x(:)]);
xExtended = linspace(xmin - 0.1*xrange, xmin + 1.1*xrange,1000);
[yfitExtended,deltaExtended] = polyconf(p,xExtended,S,Alpha=alpha);
plot(x,y,"b+")
hold on
plot(xExtended,yfitExtended,"g-")
plot(r,zeros(size(r)),"ko")
plot(xExtended,yfitExtended-deltaExtended,"r--")
plot(xExtended,yfitExtended+deltaExtended,"r--")
plot(xExtended,zeros(size(xExtended)),"k-")
xlabel("x")
ylabel("y")
legend("Data","Fit","Roots of fit","95% Prediction intervals")
title(["Fit: "+ sprintf("%.2fx^2 %+ .2fx %+ .2f",p(1),p(2),p(3))])
axis tight
hold off
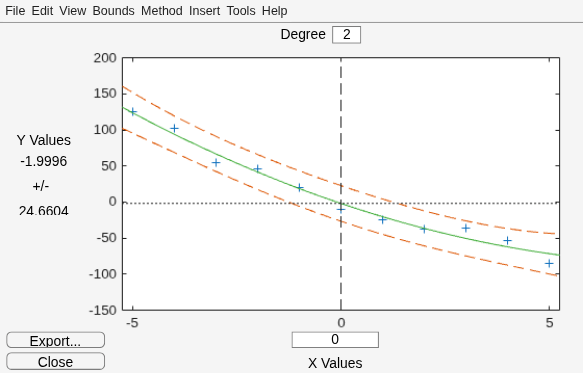
Alternatively, you can use the Polynomial Fitting Tool function for interactive polynomial fitting.
polytool(x,y,degree,alpha)
Input Arguments
Name-Value Arguments
Output Arguments
More About
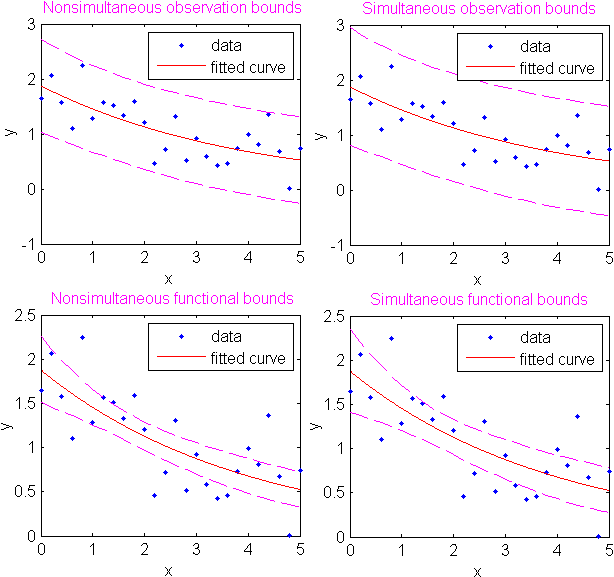
To better understand the PredOpt and
SimOpt name-value
arguments, consider the following functions:
p(x) — Unknown mean function estimated by the fit
l(x) — Lower confidence bound
u(x) — Upper confidence bound
Suppose you have a new observation yn+1 at xn+1, so that
| yn+1(xn+1) = p(xn+1) + εn+1 | (1) |
By default, the interval [ln+1(xn+1), un+1(xn+1)] is a 95% confidence bound on yn+1(xn+1).
The following combinations of the PredOpt and
SimOpt values allow you to specify other bounds.
SimOpt Value | PredOpt Value | Bounded Quantity |
|---|---|---|
"off" (default) | "observation" (default) | yn+1(xn+1) |
"off" | "curve" | p(xn+1) |
"on" | "observation" | yn+1(x) for all x |
"on" | "curve" | p(x) for all x |
In general, "observation" (prediction) intervals are wider than
"curve" (confidence) intervals, due to the additional uncertainty of
predicting a new response value (the curve plus random errors). Likewise, simultaneous
intervals are wider than nonsimultaneous intervals, due to the additional uncertainty of
bounding values for all predictor values of x.
Version History
Introduced before R2006a

