polyval
多项式计算
说明
示例
计算多项式 在点 处的值。多项式系数可以由向量 [3 2 1] 表示。
p = [3 2 1];
x = [5 7 9];
y = polyval(p,x)
y = 1×3

    86   162   262
计算定积分
创建一个向量来表示多项式被积函数 。 项不存在,因此系数为 0。
p = [3 0 -4 10 -25];
使用 polyint 和等于 0 的积分常量来对多项式求积分。
q = polyint(p)
q = 1×6

    0.6000         0   -1.3333    5.0000  -25.0000         0
通过在积分范围上计算 q,求解积分的值。
a = -1;
b = 3;
I = diff(polyval(q,[a b]))
I =
49.0667
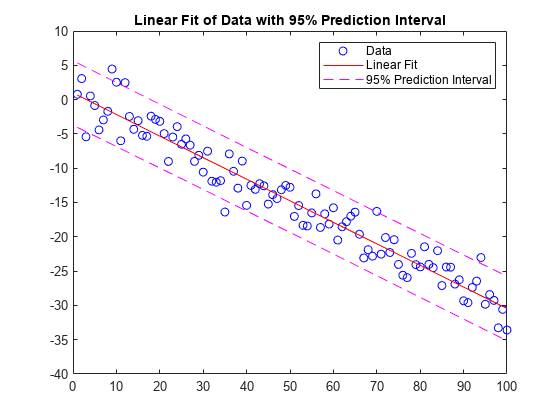
将一个线性模型拟合到一组数据点并绘制结果,其中包含预测区间为 95% 的估计值。
创建几个由样本数据点 (x,y) 组成的向量。使用 polyfit 对数据进行一次多项式拟合。指定两个输出以返回线性拟合的系数以及误差估计结构体。
x = 1:100;
y = -0.3*x + 2*randn(1,100);
[p,S] = polyfit(x,y,1)
p = 1×2

   -0.3142    0.9614
S = struct with fields:
           R: [2×2 double]
          df: 98
       normr: 22.7673
    rsquared: 0.9407
计算以 p 为系数的一次多项式在 x 中各点处的拟合值。将误差估计结构体指定为第三个输入,以便 polyval 计算标准误差的估计值。标准误差估计值在 delta 中返回。
[y_fit,delta] = polyval(p,x,S);
绘制原始数据、线性拟合和 95% 预测区间 。
plot(x,y,'bo')
hold on
plot(x,y_fit,'r-')
plot(x,y_fit+2*delta,'m--',x,y_fit-2*delta,'m--')
title('Linear Fit of Data with 95% Prediction Interval')
legend('Data','Linear Fit','95% Prediction Interval')
创建一个由 1750 - 2000 年的人口数据组成的表,并绘制数据点。
year = (1750:25:2000)';
pop = 1e6*[791 856 978 1050 1262 1544 1650 2532 6122 8170 11560]';
T = table(year, pop)
T=11×2 table
    year       pop
    ____    _________

    1750     7.91e+08
    1775     8.56e+08
    1800     9.78e+08
    1825     1.05e+09
    1850    1.262e+09
    1875    1.544e+09
    1900     1.65e+09
    1925    2.532e+09
    1950    6.122e+09
    1975     8.17e+09
    2000    1.156e+10
plot(year,pop,'o')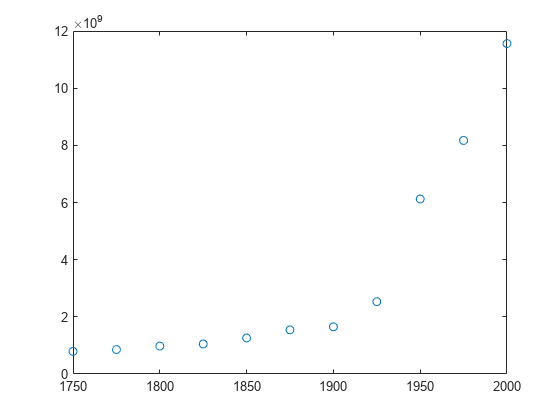
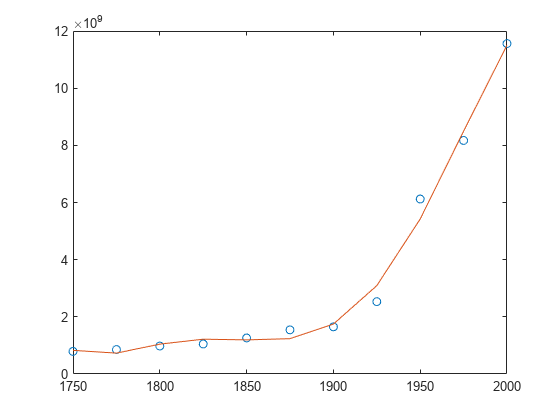
使用带三个输入的 polyfit 拟合一个使用中心化和缩放的 5 次多项式,这将改善问题的数值属性。polyfit 将 year 中的数据以 0 为进行中心化,并缩放为具有标准差 1,这可避免在拟合计算中出现病态的范德蒙矩阵。
[p,~,mu] = polyfit(T.year, T.pop, 5);
使用带四个输入的 polyval,根据缩放后的年份 (year-mu(1))/mu(2) 计算 p。绘制结果对原始年份的图。
f = polyval(p,year,[],mu);
hold on
plot(year,f)
hold off
输入参数
输出参量
扩展功能
版本历史记录
在 R2006a 之前推出