Main Content

resubPredict

Class: RegressionTree

Predict resubstitution response of tree

Syntax

Yfit = resubPredict(tree)
[Yfit,node] = resubPredict(tree)
[Yfit,node] = resubPredict(tree,Name,Value)

Description

Yfit = resubPredict(tree) returns the responses tree predicts for the data tree.X. Yfit is the predictions of tree on the data that fitrtree used to create tree.

[Yfit,node] = resubPredict(tree) returns the node numbers of tree for the resubstituted data.

[Yfit,node] = resubPredict(tree,Name,Value) predicts with additional options specified by one or more Name,Value pair arguments.

Input Arguments

expand all

tree

A regression tree constructed using fitrtree.

Name-Value Arguments

Specify optional pairs of arguments as Name1=Value1,...,NameN=ValueN, where Name is the argument name and Value is the corresponding value. Name-value arguments must appear after other arguments, but the order of the pairs does not matter.

Before R2021a, use commas to separate each name and value, and enclose Name in quotes.

Pruning level, specified as the comma-separated pair consisting of 'Subtrees' and a vector of nonnegative integers in ascending order or 'all'.

If you specify a vector, then all elements must be at least 0 and at most max(tree.PruneList). 0 indicates the full, unpruned tree and max(tree.PruneList) indicates the completely pruned tree (i.e., just the root node).

If you specify 'all', then resubPredict operates on all subtrees (i.e., the entire pruning sequence). This specification is equivalent to using 0:max(tree.PruneList).

resubPredict prunes tree to each level indicated in Subtrees, and then estimates the corresponding output arguments. The size of Subtrees determines the size of some output arguments.

To invoke Subtrees, the properties PruneList and PruneAlpha of tree must be nonempty. In other words, grow tree by setting 'Prune','on', or by pruning tree using prune.

Example: 'Subtrees','all'

Data Types: single | double | char | string

Output Arguments

Yfit

The response tree predicts for the training data.

If the Subtrees name-value argument is a scalar or is missing, label is the same data type as the training response data tree.Y.

If Subtrees contains m>1 entries, label has m columns, each of which represents the predictions of the corresponding subtree.

node

The tree node numbers where tree sends each data row.

If the Subtrees name-value argument is a scalar or is missing, node is a numeric column vector with n rows, the same number of rows as tree.X.

If Subtrees contains m>1 entries, node is a n-by-m matrix. Each column represents the node predictions of the corresponding subtree.

Examples

expand all

Load the carsmall data set. Consider Displacement, Horsepower, and Weight as predictors of the response MPG.

load carsmall
X = [Displacement Horsepower Weight];

Grow a regression tree using all observations.

Mdl = fitrtree(X,MPG);

Compute the resubstitution MSE.

Yfit = resubPredict(Mdl);
mean((Yfit - Mdl.Y).^2)
ans = 4.8952

You can get the same result using resubLoss.

resubLoss(Mdl)
ans = 4.8952

Load the carsmall data set. Consider Weight as a predictor of the response MPG.

load carsmall
idxNaN = isnan(MPG + Weight);
X = Weight(~idxNaN);
Y = MPG(~idxNaN);
n = numel(X);

Grow a regression tree using all observations.

Mdl = fitrtree(X,Y);

Compute resubstitution fitted values for the subtrees at several pruning levels.

m = max(Mdl.PruneList);
pruneLevels = 1:4:m; % Pruning levels to consider
z = numel(pruneLevels);
Yfit = resubPredict(Mdl,'SubTrees',pruneLevels);

Yfit is an n-by- z matrix of fitted values in which the rows correspond to observations and the columns correspond to a subtree.

Plot several columns of Yfit and Y against X.

figure;
sortDat = sortrows([X Y Yfit],1); % Sort all data with respect to X
plot(repmat(sortDat(:,1),1,size(Yfit,2) + 1),sortDat(:,2:end))...
    % Vectorize for efficiency
lev = cellstr(num2str((pruneLevels)','Level %d MPG'));
legend(['Observed MPG'; lev])
title 'In-Sample Fitted Responses'
xlabel 'Weight (lbs)';
ylabel 'MPG';
h = findobj(gcf);
set(h(4:end),'LineWidth',3) % Widen all lines

Figure contains an axes object. The axes object with title In-Sample Fitted Responses, xlabel Weight (lbs), ylabel MPG contains 5 objects of type line. These objects represent Observed MPG, Level 1 MPG, Level 5 MPG, Level 9 MPG, Level 13 MPG.

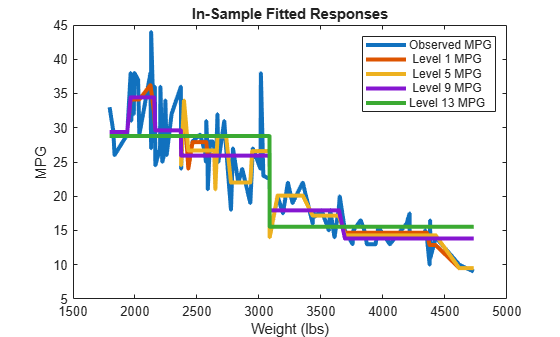
The values of Yfit for lower pruning levels tend to follow the data more closely than higher levels. Higher pruning levels tend to be flat for large X intervals.

Extended Capabilities