flightLogSignalMapping
Visualize UAV flight logs
Description
The flightLogSignalMapping object maps flight log messages to
signals that you can use to visualize the messages.
To inspect UAV logs, first load your log file using mavlinktlog, ardupilotreader or
ulogreader. Use the
preconfigured signal mapping, or map your own signal using mapSignal or
mapulog. Then, use
show to display the
list of configured plots.
For ease of use, see the provided Predefined Signals and Predefined Plots. You can also
view the details of the signals and plots of a flightLogSignalMapping
object by using the info object
function.
Creation
Description
mapper = flightLogSignalMappingmapSignal.
mapper = flightLogSignalMapping("tlog")
mapper = flightLogSignalMapping("ulog")mapulog
function to map log messages from different PX4 versions.
mapper = flightLogSignalMapping("bin")
Properties
Names of all mapped signals, specified as a string array.
Example:
["Accel" "Gyro" "Mag" "Barometer" "Gyro2"]
Data Types: string
Names of plots that are available based on the mapped signals, specified as a string
array. To add plots to this list, either map signals for the Predefined Plots or call updatePlot.
Example:
["Accel" "Gyro" "Mag" "Barometer" "Gyro2"]
Data Types: string
Object Functions
checkSignal | Check mapped signal |
copy | Create deep copy of flight log signal mapping object |
extract | Extract UAV flight log signals as timetables |
info | Signal mapping and plot information for UAV log signal mapping |
mapSignal | Map UAV flight log signal |
mapulog | Map PX4 ULOG messages to signals |
show | Display plots for inspection of UAV logs |
updatePlot | Update UAV flight log plot functions |
Examples
Use the ulogreader object to read your PX4 log file.
data = ulogreader("yourLogFile.ulg")Create a flight log signal mapping object.
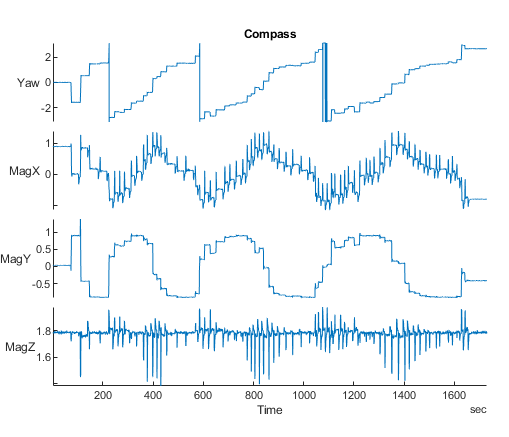
mapper = flightLogSignalMapping('ulog')Use the show function to generate a plot of the estimated yaw and
magnetometer readings.
show(mapper,data,PlotsToShow="Compass")This figure shows the Compass plot that is generated from a
sample flight log with a duration of 800 seconds.

To verify if the extended Kalman filter (EKF) accurately estimates yaw during the flight, first extract the EKF heading innovations signal as a timetable.
HeadingInnovationsData = extract(mapper,data,"EstimatorInnovationHeading");Then, extract the EKF magnetometer status signal as a timetable.
EstimatorStatusFlags = extract(mapper,data,"EstimatorStatusFlagMagnetometer");
Combine the EKF heading innovations and magnetometer status timetables.
combinedData = synchronize(magStatusFlags{1},HeadingInnovationsData{1},"union","nearest");
Create a stacked plot of the EKF heading innovation and the
RejectYaw flag.
stackedplot(combinedData(:,["Heading","RejectYaw"]),DisplayLabels=["Heading Innovation","RejectYaw"])
grid on
This figure shows the stacked plot that is generated from the sample flight log. The
low heading innovation and the absence of RejectYaw flag trigger
indicate that the EKF accurately estimates yaw during the flight.

More About
The flightLogSignalMapping object has a set of predefined signals and plots. Use
info object
function to view the signals, and to check if a signal is already mapped and ready to
plot.
Signals with the format SignalName# support mapping multiple signals of the
same type. Replace # with incremental integer for each signal name of
that type.
Predefined Signals
| Signal Name | Description | Fields | Units |
|---|---|---|---|
Accel# | Raw accelerometer reading from IMU sensor | AccelX, AccelY, AccelZ | m/s^2, m/s^2, m/s^2 |
Airspeed# | Airspeed reading of pressure differential, indicated air speed, and temperature | PressDiff, IndicatedAirSpeed, Temperature | Pa, m/s, degreeC |
AttitudeEuler | Attitude of UAV in Euler (ZYX) form | Roll, Pitch, Yaw | rad, rad, rad |
AttitudeRate | Angular velocity along each body axis | BodyRotationRateX, BodyRotationRateY, BodyRotationRateZ | rad/s, rad/s, rad/s |
AttitudeTargetEuler | Target attitude of UAV in Euler (ZYX) form | TargetRoll, TargetPitch, TargetYaw | rad, rad, rad |
Barometer# | Barometer readings for absolute pressure, relative pressure, and temperature | PressAbs, PressAltitude, Temperature | Pa, m, degreeC |
Battery | Voltage readings for battery and remaining battery capacity (%) | Voltage1,Voltage2, ... Voltage16, RemainingCapacity | v, v, ... v, % |
EstimatorInnovationAirspeed | Extended Kalman Filter (EKF) airspeed innovation and innovation variance | Airspeed, Var_Airspeed | m/s, (m/s)^2 |
EstimatorInnovationGPS | EKF GPS velocity and position innovations and innovation variances | V_X, V_Y, V_Z, P_X, P_Y, P_Z, Var_V_X, Var_V_Y, Var_V_Z,
Var_P_X, Var_P_Y, Var_P_Z | m/s, m/s, m/s, m, m, m, (m/s)^2, (m/s)^2, (m/s)^2, m^2, m^2,
m^2 |
EstimatorInnovationHeading | EKF heading innovation and innovation variance | Heading, Var_Heading | rad, rad^2 |
EstimatorInnovationHeight | EKF range sensor and barometer height innovations and innovation variances | RangeHeight, BaroHeight, Var_RangeHeight,
Var_BaroHeight | m, m^2, m^2 |
EstimatorInnovationMagnetometer | EKF magnetometer innovation and innovation variance | X, Y, Z, Var_X, Var_Y, Var_Z | Gauss, Gauss, Gauss, Gauss^2, Gauss^2, Gauss^2
|
EstimatorInnovationOpticalFlow | EKF optical flow sensor innovation and innovation variance | X, Y, Var_X, Var_Y | rad/sec, rad/sec, (rad/sec)^2, (rad/sec)^2 |
EstimatorStatesIMUBias | EKF inertial measurement unit (IMU) delta angle and velocity bias estimates and bias estimate variances | DeltaAngleBiasX, DeltaAngleBiasY, DeltaAngleBiasZ",
DeltaVelocityBiasX, DeltaVelocityBiasY, DeltaVelocityBiasZ,
Var_DeltaAngleBiasX, Var_DeltaAngleBiasY, Var_DeltaAngleBiasZ,
Var_DeltaVelocityBiasX, Var_DeltaVelocityBiasY,
Var_DeltaVelocityBiasZ | rad, rad, rad, m/s, m/s, m/s, rad^2, rad^2, rad^2, (m/s)^2,
(m/s)^2, (m/s)^2 |
EstimatorStatesMagnetometerBias | EKF Earth magnetic field and UAV body frame magnetic field bias estimates and bias estimate variances | EarthMagneticFieldN, EarthMagneticFieldE, EarthMagneticFieldD,
BodyMagneticFieldX, BodyMagneticFieldY, BodyMagneticFieldZ,
Var_EarthMagneticFieldN, Var_EarthMagneticFieldE,
Var_EarthMagneticFieldD, Var_BodyMagneticFieldX, Var_BodyMagneticFieldY,
Var_BodyMagneticFieldZ | gauss, gauss, gauss, gauss, gauss, gauss, gauss^2, gauss^2,
gauss^2, gauss^2, gauss^2, gauss^2 |
EstimatorStatesWind | EKF wind estimate and estimate variance | WindNorth, WindEast, Var_WindNorth,
Var_WindEast | m/s, m/s, (m/s)^2, (m/s)^2 |
EstimatorStatusControlMode | EKF logic states, specified as logical values | CS_TILT_ALIGN, CS_YAW_ALIGN, CS_GPS, CS_OPT_FLOW, CS_MAG_HDG,
CS_MAG_3D, CS_MAG_DEC, CS_IN_AIR, CS_WIND, CS_BARO_HGT, CS_RNG_HGT,
CS_GPS_HGT, CS_EV_POS, CS_EV_YAW, CS_EV_HGT, CS_BETA, CS_MAG_FIELD,
CS_FIXED_WING, CS_MAG_FAULT, CS_ASPD, CS_GND_EFFECT, CS_RNG_STUCK,
CS_GPS_YAW, CS_MAG_ALIGNED, CS_EV_VEL, CS_SYNTHETIC_MAG_Z,
CS_VEHICLE_AT_REST, CS_GPS_YAW_FAULT, CS_RNG_FAULT | None |
EstimatorStatusFlagAirspeed | Flag that indicates whether the EKF rejects the airspeed observation | RejectAirspeed | None |
EstimatorStatusFlagHeightAboveGround | Flag that indicates whether the EKF rejects the height above ground observation | RejectHeightAboveGround | None |
EstimatorStatusFlagHorizontalStates | Flags that indicate whether the EKF rejects the horizontal velocity and position observations | RejectVelocity, RejectPosition | None |
EstimatorStatusFlagMagnetometer | Flags that indicate whether the EKF rejects the magnetometer and yaw observations | RejectX, RejectY, RejectZ, RejectYaw | None |
EstimatorStatusFlagOpticalFlow | Flags that indicate whether the EKF rejects the optical flow observations | RejectX, RejectY | None |
EstimatorStatusFlagSideslip | Flag that indicates whether the EKF rejects the synthetic sideslip observation | RejectSyntheticSideslip | None |
EstimatorStatusFlagVerticalStates | Flags that indicate whether the EKF rejects the vertical velocity and position observations | RejectVelocity, RejectPosition | None |
EstimatorStatusFilterFault | Flags that indicate whether the EKF encounters faults such as numerical errors, bad data, or clipping | NUMERIC_ERROR_MAG_X, NUMERIC_ERROR_MAG_Y, NUMERIC_ERROR_MAG_Z,
NUMERIC_ERROR_MAG_HDG, NUMERIC_ERROR_MAG_DEC, NUMERIC_ERROR_ASPD,
NUMERIC_ERROR_SYNTHETIC_BETA, NUMERIC_ERROR_OPT_FLOW_X,
NUMERIC_ERROR_OPT_FLOW_Y, NUMERIC_ERROR_VEL_N, NUMERIC_ERROR_VEL_E,
NUMERIC_ERROR_VEL_D, NUMERIC_ERROR_POS_N, NUMERIC_ERROR_POS_E,
NUMERIC_ERROR_POS_D, NUMERIC_BAD_DELTA_VEL_BIAS,
NUMERIC_BAD_VERTICAL_ACCEL, NUMERIC_DELTA_VEL_CLIPPING | None |
EstimatorStatusGPSCheckFail | Flags that indicate the status of GPS checks | GPS_CHECK_FAIL_GPS_FIX, GPS_CHECK_FAIL_MIN_SAT_COUNT,
GPS_CHECK_FAIL_MAX_PDOP GPS_CHECK_FAIL_MAX_HORZ_ERR,
GPS_CHECK_FAIL_MAX_VERT_ERR, GPS_CHECK_FAIL_MAX_SPD_ERR,
GPS_CHECK_FAIL_MAX_HORZ_DRIFT, GPS_CHECK_FAIL_MAX_VERT_DRIFT,
GPS_CHECK_FAIL_MAX_HORZ_SPD_ERR, GPS_CHECK_FAIL_MAX_VERT_SPD_ERR,
GPS_CHECK_FAIL_SPOOFED | None |
EstimatorStatusTestRatio | Low-pass filtered ratio of the largest innovation to the innovation test limit | Heading, Velocity, Position, Height, TrueAirspeed,
HeightAboveGround, SyntheticSideslip | None |
GPS# | GPS readings for latitude, longitude, altitude, ground speed, course angle, and number of satellites visible | Latitude, Longitude, Altitude, GroundSpeed, CourseAngle,
SatellitesVisible | degree, degree, m, m/s, degree, N/A |
Gyro# | Raw body angular velocity readings from IMU sensor | GyroX, GyroY, GyroZ | rad/s, rad/s, rad/s |
LocalENU | Local ENU coordinates estimated by the UAV | X, Y, Z | m, m, m |
LocalENUTarget | Target location in local ENU coordinates | XTarget, YTarget, ZTarget | m, m, m |
LocalENUVel | Local ENU velocity estimated by the UAV | VX, VY, VZ | m/s, m/s, m/s |
LocalENUVelTarget | Target velocity in local ENU coordinates | VXTarget, VYTarget, VZTarget | m/s, m/s, m/s |
LocalNED | Local NED coordinates estimated by the UAV | X, Y, Z | m, m, m |
LocalNEDTarget | Target location in local NED coordinates | XTarget, YTarget, ZTarget | m, m, m |
LocalNEDVel | Local NED velocity estimated by the UAV | VX, VY, VZ | m/s, m/s, m/s |
LocalNEDVelTarget | Target velocity in local NED coordinates | VXTarget, VYTarget, VZTarget | m/s, m/s, m/s |
Mag# | Raw magnetometer reading from IMU sensor | MagX, MagY, MagZ | Gs, Gs, Gs |
After mapping signals to the list of predefined signals, you can use specific predefined plots
with the show object
function. To view a list of available plots and their associated signals for a
flightLogSignalMapping object, use the info object
function. If you want to define custom plots based on signals, use the updatePlot
object function.
Each predefined plot has a set of required signals that it must map.
Predefined Plots
| Plot | Description | Signals |
|---|---|---|
| Extended Kalman Filter (EKF) airspeed innovation and innovation variance | EstimatorInnovationAirspeed |
| Stacked plot of roll, pitch, and yaw angles and body rotation rates | AttitudeEuler, AttitudeRate, Gyro# |
| Estimated attitude of the UAV and the attitude target set point | AttitudeEuler, AttitudeTargetEuler |
| Stacked plot of battery voltage | Battery |
| Estimated yaw and magnetometer readings | AttitudeEuler, Mag#, GPS# |
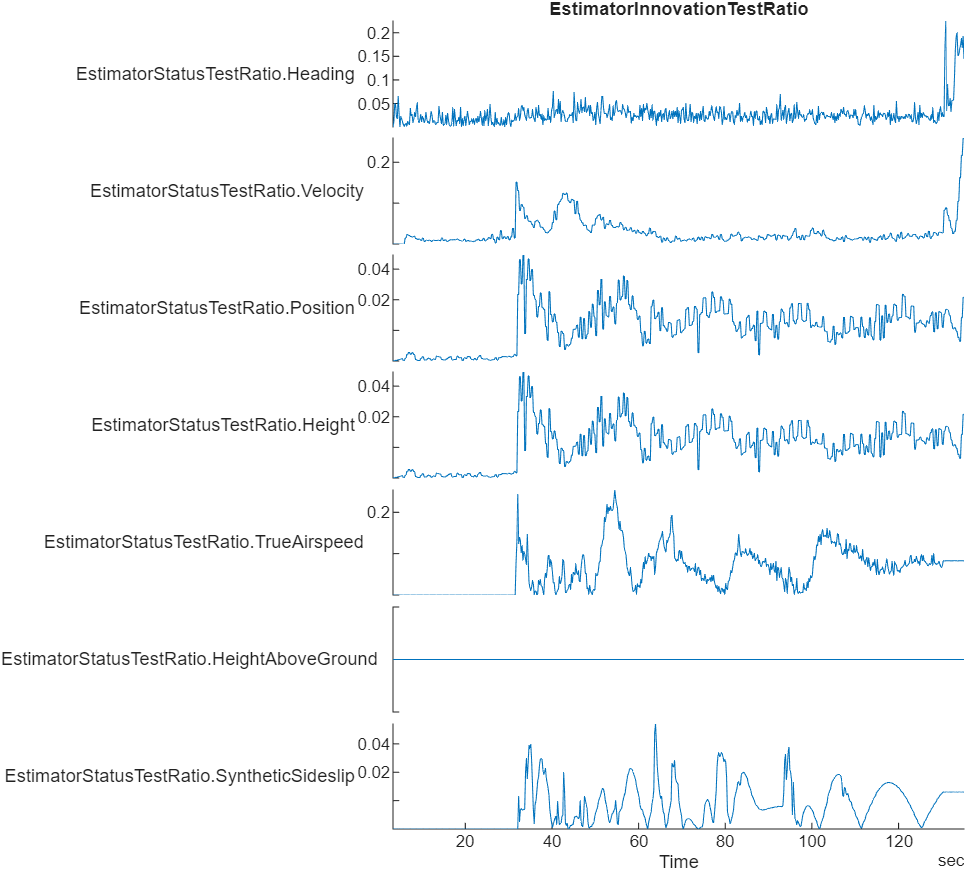
| Stacked plot of the ratio of the largest EKF innovation to the innovation test limit | EstimatorStatusTestRatio |
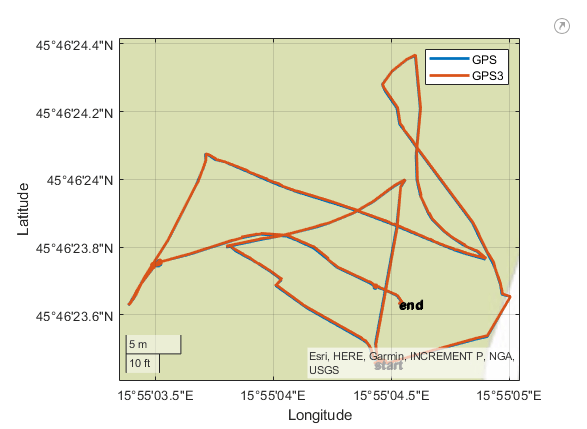
| Raw Lat-Lon plot for GPS sensor readings | GPS# |
| Stacked plot of EKF GPS velocity and position innovations, and innovation variances | EstimatorInnovationGPS |
| Stacked plot of EKF heading innovation and innovation variance | EstimatorInnovationHeading |
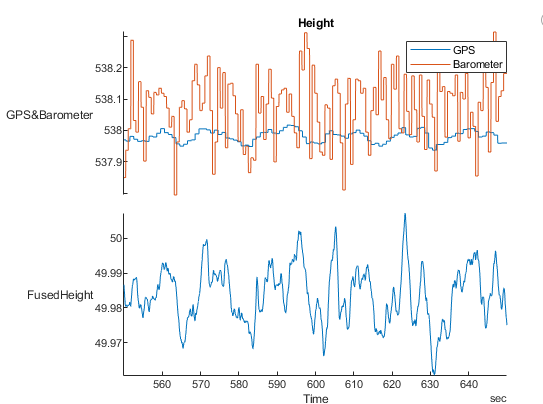
| Stacked plots of barometer reading, GPS altitude reading, and fused height estimate | Barometer#, GPS#, LocalNED |
| Stacked plot of EKF range sensor and barometer height innovations and innovation variances | EstimatorInnovationHeight |
| Stacked plot of EKF inertial measurement unit (IMU) delta angle and velocity bias estimates and bias estimate variances | EstimatorStatesIMUBias |
| Stacked plot of EKF Earth magnetic field and UAV body frame magnetic field bias estimates and bias estimate variances | EstimatorStatesMagnetometerBias |
| Stacked plot of EKF Earth magnetic field and UAV body frame magnetic field bias estimates and bias estimates variancest | EstimatorInnovationMagnetometert |
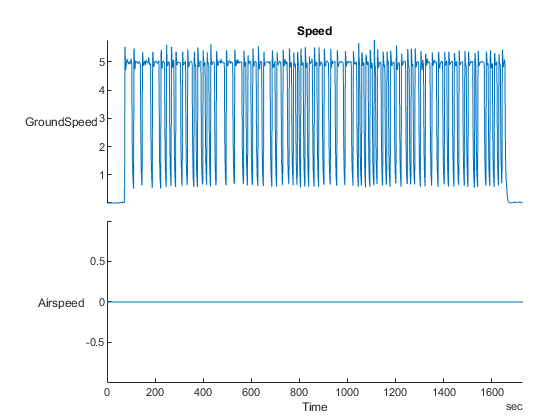
| Stacked plot of ground velocity and air speed | GPS#, Airspeed# |
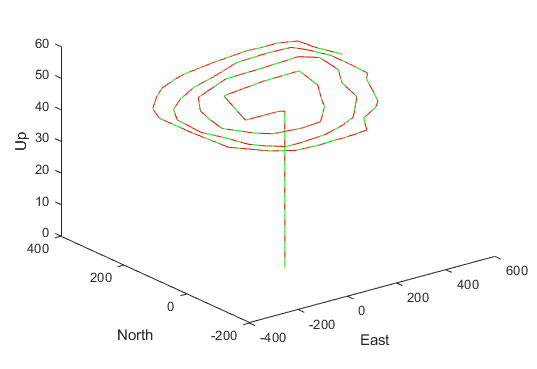
| Trajectory in local NED coordinates versus target set points | LocalNED, LocalNEDTarget |
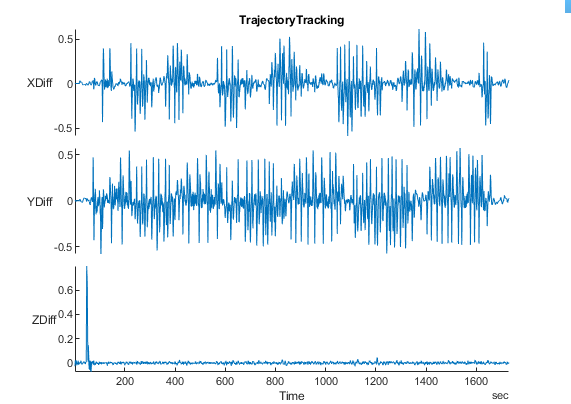
| Error between desired and actual position in NED coordinates | LocalNED, LocalNEDTarget |
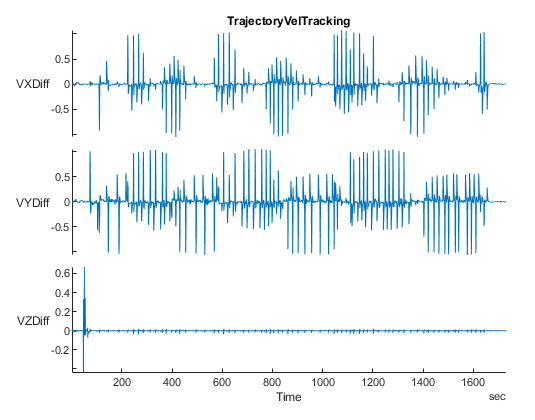
| Error between desired and actual velocity in NED coordinates | LocalNEDVel, LocalNEDVelTarget |
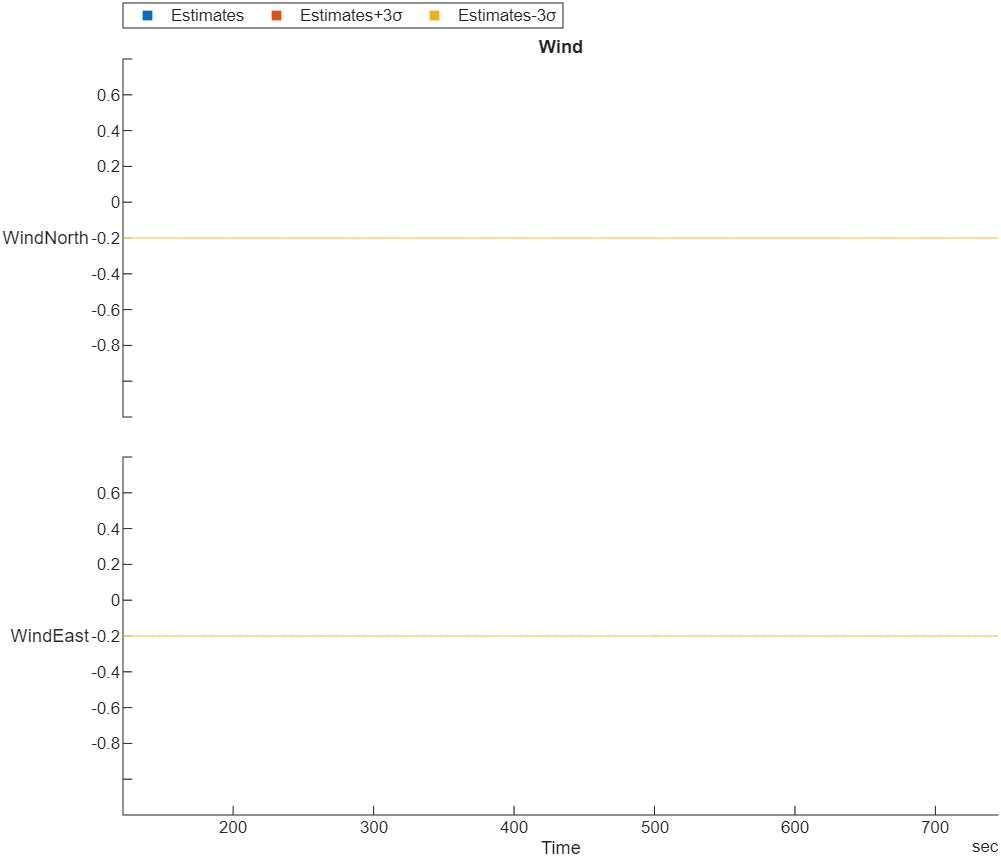
| Wind estimate and estimate variance | EstimatorStatesWind |
Version History
Introduced in R2020b You can now use the mapulog function
to map log messages from PX4 flight logs.
The flightLogSignalMapping object contains new predefined signals and
plots that you can use to analyze EKF messages from flight logs. For more details, see Predefined Signals and Predefined Plots.
The flightLogSignalMapping object now enables you to visualize
ArduPilot log file (.bin) that you import using ardupilotreader
object.
See Also
MATLAB Command
You clicked a link that corresponds to this MATLAB command:
Run the command by entering it in the MATLAB Command Window. Web browsers do not support MATLAB commands.
选择网站
选择网站以获取翻译的可用内容,以及查看当地活动和优惠。根据您的位置,我们建议您选择:。
您也可以从以下列表中选择网站:
如何获得最佳网站性能
选择中国网站(中文或英文)以获得最佳网站性能。其他 MathWorks 国家/地区网站并未针对您所在位置的访问进行优化。
美洲
- América Latina (Español)
- Canada (English)
- United States (English)
欧洲
- Belgium (English)
- Denmark (English)
- Deutschland (Deutsch)
- España (Español)
- Finland (English)
- France (Français)
- Ireland (English)
- Italia (Italiano)
- Luxembourg (English)
- Netherlands (English)
- Norway (English)
- Österreich (Deutsch)
- Portugal (English)
- Sweden (English)
- Switzerland
- United Kingdom (English)


