plot
绘制点
说明
示例
读取一个图像。
I = imread("cameraman.tif");检测角点特征。
featurePoints = detectHarrisFeatures(I);
用检测到的特征绘制特征图像。
imshow(I);
hold on;
plot(featurePoints);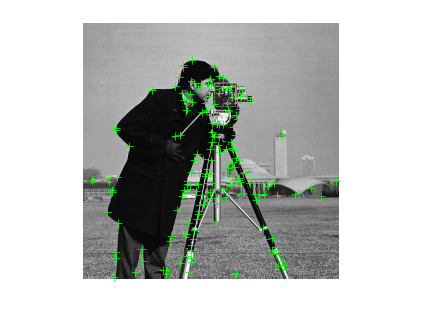
输入参数
版本历史记录
在 R2011b 中推出
绘制点
读取一个图像。
I = imread("cameraman.tif");检测角点特征。
featurePoints = detectHarrisFeatures(I);
用检测到的特征绘制特征图像。
imshow(I);
hold on;
plot(featurePoints);
在 R2011b 中推出