plot
绘制点
说明
示例
读取一个图像。
I = imread("cameraman.tif");从图像中检测 KAZE 点。
points = detectKAZEFeatures(I);
从检测到的点中提取 KAZE 特征。
[features,valid_points] = extractFeatures(I,points);
绘制 10 个最强的点并显示其方向。
imshow(I)
hold on
strongestPoints = selectStrongest(valid_points,10);
plot(strongestPoints,showOrientation=true)
hold off
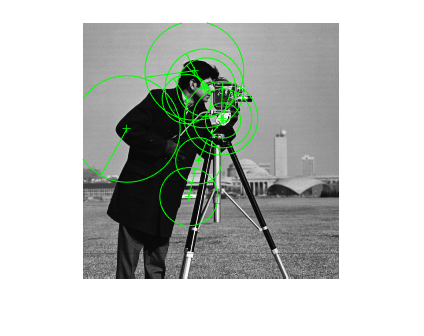
I = imread("cameraman.tif");
points = detectSURFFeatures(I);
[features, valid_points] = extractFeatures(I,points);
可视化 10 个最强的 SURF 特征,包括在描述符提取过程中确定的这些特征的尺度和方向。
imshow(I);
hold on;
strongestPoints = valid_points.selectStrongest(10);
strongestPoints.plot("showOrientation",true);

输入参数
名称-值参数
版本历史记录
在 R2011b 中推出