plot
Plot 3-D map points and estimated camera trajectory in stereo visual SLAM
Since R2024a
Description
plot( plots the 3-D map points and
estimated camera trajectory from the visual SLAM object vslam)vslam.
plot(
specifies options using one or more name-value arguments. For example,
vslam,Name=Value)MarkerSize=10 sets the diameter of the marker size to 10 points.
ax = plot(___)
Examples
Perform stereo visual simultaneous localization and mapping (vSLAM) using the data from the UTIAS Long-Term Localization and Mapping Dataset provided by University of Toronto Institute for Aerospace Studies. You can download the data to a directory using a web browser, or by running this code:
ftpObj = ftp("asrl3.utias.utoronto.ca");
tempFolder = fullfile(tempdir);
dataFolder = [tempFolder,'2020-vtr-dataset\UTIAS-In-The-Dark\'];
zipFileName = [dataFolder,'run_000005.zip'];
folderExists = exist(dataFolder,"dir");
Create a folder in a temporary directory to save the downloaded file and extract its contents.
if ~folderExists
    mkdir(dataFolder)
    disp("Downloading run_000005.zip (818 MB). This download can take a few minutes.")
    mget(ftpObj,"/2020-vtr-dataset/UTIAS-In-The-Dark/run_000005.zip",tempFolder);

    disp("Extracting run_000005.zip (818 MB) ...")
    unzip(zipFileName,dataFolder);
end
Create two imageDatastore objects to store the stereo images.
imgFolderLeft = [dataFolder,'\images\left\'];
imgFolderRight = [dataFolder,'\images\right\'];
imdsLeft = imageDatastore(imgFolderLeft);
imdsRight = imageDatastore(imgFolderRight);
Specify the intrinsic parameters and the baseline of the stereo camera, and use them to create a stereo visual SLAM object. The focal length, principal point, and image size is in pixels, and the baseline is in meters.
focalLength = [387.777 387.777];
principalPoint = [257.446 197.718];
imageSize = [384 512];
intrinsics = cameraIntrinsics(focalLength,principalPoint,imageSize);
baseline = 0.239965;
vslam = stereovslam(intrinsics,baseline,MaxNumPoints=600, ...
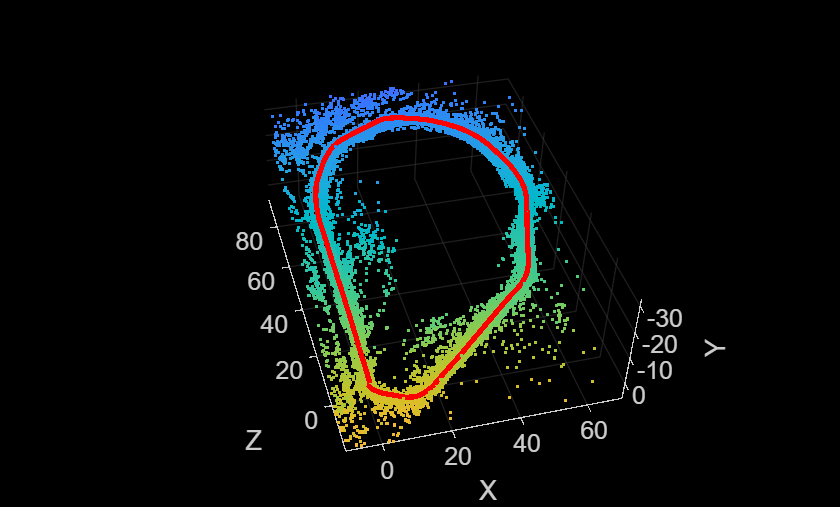
TrackFeatureRange=[30 120],SkipMaxFrames=5);Process each pair of stereo images and visualize the camera poses and 3-D map points.
for i = 1:numel(imdsLeft.Files)
    leftImage = readimage(imdsLeft,i);
    rightImage = readimage(imdsRight,i);
    addFrame(vslam,leftImage,rightImage);

    if hasNewKeyFrame(vslam)
        % Query 3-D map points and camera poses
        xyzPoints = mapPoints(vslam);
        [camPoses,viewIds] = poses(vslam);

        % Display 3-D map points and camera trajectory
        plot(vslam);
    end

    % Get current status of system
    status = checkStatus(vslam);

    % Stop adding frames when tracking is lost
    if status == uint8(0)
        break
    end
end
Once all the frames have been processed, reset the system.
while ~isDone(vslam)
    plot(vslam)
end
reset(vslam)
Input Arguments
Name-Value Arguments
Output Arguments
Version History
Introduced in R2024a
See Also
Objects
Functions
addFrame|checkStatus|hasNewKeyFrame|isDone|mapPoints|poses|reset