Main Content

createDatastores

Create datastores pointing to signal and label data

Since R2021a

    Description

    [sigData,lblData] = createDatastores(lss,lblNames) creates the datastores sigData and lblData containing signal member data and label data.

    • The createDatastores function creates the datastores from the labeled signal set lss and labels specified in lblNames.

    • createDatastores does not apply to sublabels. Set lblNames to one or more parent label names to get the parent labels and the corresponding sublabel values.

    example

    [sigData,lblData] = createDatastores(lss,lblNames,Name=Value) specifies additional options using name-value arguments.

    • You must specify roiTimeFrequency label definitions in lblNames to use this syntax. To see which label definitions are roiTimeFrequency in a labeled signal set lss, type getLabelDefinitions(lss,LabelType="roiTimeFrequency").

    • You can specify multiple name-value arguments. For example,

      [sigData,lblData] = createDatastores(lss,"Atom", ...
          TimeFrequencyMapFormat="image",TimeFrequencyLabelFormat="mask")
      creates datastores from the labeled signal set lss and time-frequency ROI label definition "Atom". The createDatastores function returns the time-frequency map image in sigData and the ROI time-frequency label mask in lblData.

    (since R2025a)

    example

    Examples

    collapse all

    Load a labeled signal set containing recordings of whale songs.

    load whales
    lss
    lss = 
      labeledSignalSet with properties:
    
                 Source: {2×1 cell}
             NumMembers: 2
        TimeInformation: "sampleRate"
             SampleRate: 4000
                 Labels: [2×3 table]
            Description: "Characterize wave song regions"
    
     Use labelDefinitionsHierarchy to see a list of labels and sublabels.
     Use setLabelValue to add data to the set.


    Display the labels for the first member of the set.

    lss.Labels(1,:)
    ans=1×3 table
                     WhaleType    MoanRegions    TrillRegions
                     _________    ___________    ____________
    
        Member{1}      blue       {3×2 table}    {1×3 table} 


    Get the names of the labels in the set. Create a signal datastore with the signal information and an array datastore with the label information.

    lbls = getLabelNames(lss);
    [sgd,lbd] = createDatastores(lss,lbls)
    sgd = 
      signalDatastore with properties:
    
                    MemberNames:{
                                'Member{1}';
                                'Member{2}'
                                }
                  Members: {2×1 cell}
                 ReadSize: 1
               SampleRate: 4000
           OutputDataType: "same"
        OutputEnvironment: "cpu"
    
    
    lbd = 
      ArrayDatastore with properties:
    
                  ReadSize: 1
        IterationDimension: 1
                OutputType: "cell"


    Display the labels for the first member of the set.

    lbls = read(lbd);
    lbls{:}
    ans=1×3 table
        WhaleType    MoanRegions    TrillRegions
        _________    ___________    ____________
    
          blue       {3×2 table}    {1×3 table} 


    Specify the path to a set of audio signals included as MAT files with MATLAB®. Each file contains a signal variable and a sample rate. List the names of the files.

    folder = fullfile(matlabroot,"toolbox","matlab","audiovideo");
    lst = dir(append(folder,"/*.mat"));
    nms = {lst(:).name}'
    nms = 7×1 cell
        {'chirp.mat'   }
        {'gong.mat'    }
        {'handel.mat'  }
        {'laughter.mat'}
        {'mtlb.mat'    }
        {'splat.mat'   }
        {'train.mat'   }


    Create a signal datastore that points to the specified folder. Set the sample rate variable name to Fs, which is common to all files. Generate a subset of the datastore that excludes the file mtlb.mat. Use the subset datastore as the source for a labeledSignalSet object.

    sds = signalDatastore(folder,SampleRateVariableName="Fs");
    sds = subset(sds,~strcmp(nms,"mtlb.mat"));
    lss = labeledSignalSet(sds);

    Create three label definitions to label the signals:

    • Define a logical attribute label that is true for signals that contain human voices.

    • Define a numeric point label that marks the location and amplitude of the maximum of each signal.

    • Define a categorical region-of-interest (ROI) label to pick out nonoverlapping, uniform-length random regions of each signal.

    Add the signal label definitions to the labeled signal set.

    vc = signalLabelDefinition("Voice",LabelType="attribute", ...
        LabelDataType="logical",DefaultValue=false);
    mx = signalLabelDefinition("Maximum",LabelType="point", ...
        LabelDataType="numeric");
    rs = signalLabelDefinition("RanROI",LabelType="ROI", ...
        LabelDataType="categorical",Categories=["ROI" "other"]);
    addLabelDefinitions(lss,[vc mx rs])

    Label the signals:

    • Label 'handel.mat' and 'laughter.mat' as having human voices.

    • Use the islocalmax function to find the maximum of each signal. Label its location and value.

    • Use the randROI function to generate as many regions of length N/10 samples as can fit in a signal of length N given a minimum separation of N/6 samples between regions. Label their locations and assign them to the ROI category.

    When labeling points and regions, convert sample values to time values. Subtract 1 to account for MATLAB array indexing and divide by the sample rate.

    kj = 1;
    while hasdata(sds)
        
        [sig,info] = read(sds);
        fs = info.SampleRate;
    
        [~,fn] = fileparts(info.FileName);
        if fn=="handel" || fn=="laughter"
            setLabelValue(lss,kj,"Voice",true)
        end
        
        xm = find(islocalmax(sig,MaxNumExtrema=1));
        setLabelValue(lss,kj,"Maximum",(xm-1)/fs,sig(xm))
    
        N = length(sig);
        rois = randROI(N,round(N/10),round(N/6));
        setLabelValue(lss,kj,"RanROI",(rois-1)/fs, ...
            repelem("ROI",size(rois,1)))
    
        kj = kj+1;
        
    end

    Verify that only two signals contain voices.

    countLabelValues(lss,"Voice")
    ans=2×3 table
        Voice    Count    Percent
        _____    _____    _______
    
        false      4      66.667 
        true       2      33.333 


    Verify that two signals have a maximum amplitude of 1.

    countLabelValues(lss,"Maximum")
    ans=5×4 table
               Maximum            Count    Percent    MemberCount
        ______________________    _____    _______    ___________
    
        0.80000000000000004441      1      16.667          1     
        0.89113331915798421612      1      16.667          1     
        0.94730769230769229505      1      16.667          1     
        1                           2      33.333          2     
        1.0575668990330560071       1      16.667          1     


    Verify that each signal has four nonoverlapping random regions of interest.

    countLabelValues(lss,"RanROI")
    ans=2×4 table
        RanROI    Count    Percent    MemberCount
        ______    _____    _______    ___________
    
        ROI        24        100           6     
        other       0          0           0     


    Create two datastores with the data in the labeled signal set:

    • The signalDatastore (Signal Processing Toolbox) object sd contains the signal data.

    • The arrayDatastore object ld contains the labeling information. Specify that you want to include the information corresponding to all the labels you created.

    [sd,ld] = createDatastores(lss,["Voice" "RanROI" "Maximum"]);

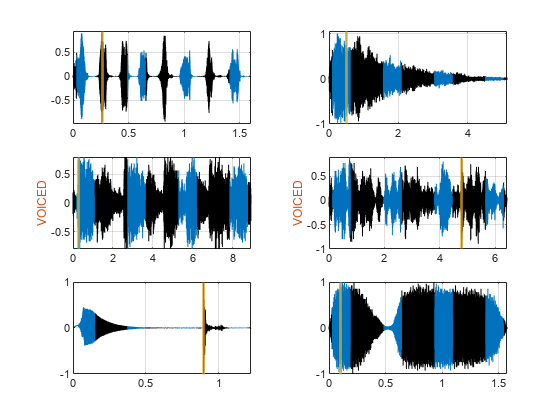
    Use the information in the datastores to plot the signals and display their labels.

    • Use a signalMask (Signal Processing Toolbox) object to highlight the regions of interest in blue.

    • Plot yellow lines to mark the locations of the maxima.

    • Add a red axis label to the signals that contain human voices.

    tiledlayout flow
    
    while hasdata(sd)
    
        [sg,nf] = read(sd);
        
        lbls = read(ld);
        
        nexttile
        
        msk = signalMask(lbls{:}.RanROI{:},SampleRate=nf.SampleRate);
        plotsigroi(msk,sg)
        colorbar off
        xlabel('')
        
        xline(lbls{:}.Maximum{:}.Location, ...
            LineWidth=2,Color="#EDB120")
        
        if lbls{:}.Voice{:}
            ylabel("VOICED",Color="#D95319")
        end
    
    end

    Figure contains an axes object. The axes object contains 4 objects of type line, constantline.

    function roilims = randROI(N,wid,sep)
    
    num = floor((N+sep)/(wid+sep));
    hq = histcounts(randi(num+1,1,N-num*wid-(num-1)*sep),(1:num+2)-1/2);
    roilims = (1 + (0:num-1)*(wid+sep) + cumsum(hq(1:num)))' + [0 wid-1];
    
    end

    Since R2025a

    Label Gaussian atoms in the time-frequency domain using a time-frequency region-of-interest (ROI) label definition and spectrogram options.

    Generate Signal and Visualize Spectrogram

    Generate a signal that consists of a voltage-controlled oscillator and four Gaussian atoms. The signal is sampled at 14 kHz for two seconds. Plot the spectrogram of the signal.

    Fs = 14000;
    t = (0:1/Fs:2)';
    st = 0.01;
    gaussFun = @(A,x,mu,f) exp(-(x-mu).^2/(2*st^2)).*sin(2*pi*f.*x)*A';
    atomTimeCenters = [0.2 0.5 1 1.75];
    atomFreqCenters = [2 6 2 5]*1000;
    s = gaussFun([1 1 1 1]/10,t,atomTimeCenters,atomFreqCenters);
    x = vco(chirp(t+.1,0,t(end),3).*exp(-2*(t-1).^2),[0.1 0.4]*Fs,Fs);
    s = s/10+x;
    
    bt = 0.2;
    tr = 0.05;
    op = 99;
    pspectrum(s,Fs,"spectrogram", ...
        Leakage=bt,TimeResolution=tr,OverlapPercent=op)

    Figure contains an axes object. The axes object with title Fres = 64.5333 Hz, Tres = 50 ms, xlabel Time (s), ylabel Frequency (kHz) contains an object of type image.

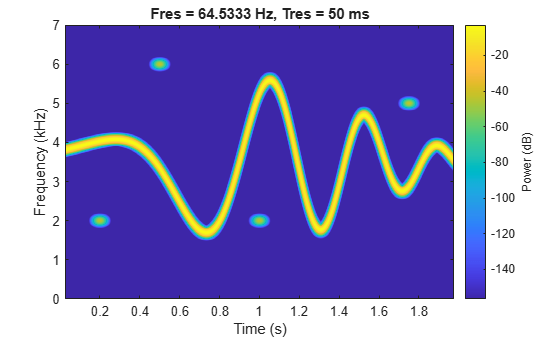
    The spectrogram shows four patches in time-frequency domain that correspond with the Gaussian atoms. Define the times and frequencies for all the atoms.

    atomTimes = atomTimeCenters'+[-st st]*5.5;
    atomFreqs = atomFreqCenters'+[-1 1]*200;

    Label Signal in Time-Frequency Domain

    Create a logical time-frequency ROI label definition to label the Gaussian atoms. Specify spectrogram options with leakage properties.

    opts = labelSpectrogramOptions("leakage", ...
        Leakage=40*(1-bt),Overlap=op, ...
        TimeResolutionMode="specify",TimeResolution=tr);
    
    lblDef = signalLabelDefinition("Atom", ...
        LabelDataType="logical", ...
        LabelType="roiTimeFrequency",TimeFrequencyOptions=opts);

    Create a labeled signal set from the signal and time-frequency ROI label definition.

    lss = labeledSignalSet(s,lblDef,SampleRate=Fs);

    Label the four atoms in time-frequency domain. Set the label values to true.

    setLabelValue(lss,1,"Atom",atomTimes,atomFreqs,true(1,4))

    Visualize Time-Frequency Image and Label Mask

    Create datastores from the labeled signal set for the time-frequency ROI label.

    imSize = [512 768];
    [sds,ads] = createDatastores(lss,"Atom", ...
        TimeFrequencyMapFormat="image", ...
        TimeFrequencyImageSize=imSize, ...
        TimeFrequencyLabelFormat="mask", ...
        TimeFrequencyMaskPriority=true);

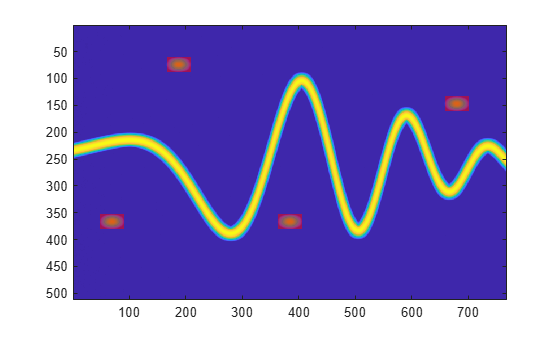
    Read and show the time-frequency image.

    imagesc(read(sds))

    Figure contains an axes object. The axes object contains an object of type image.

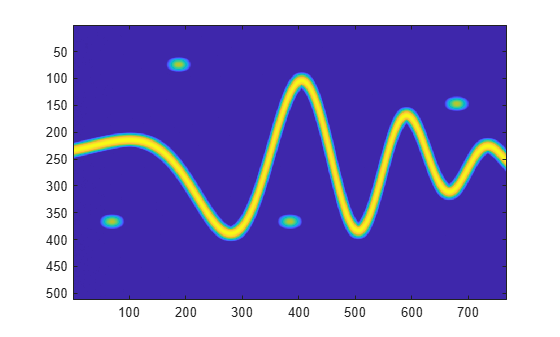
    Read the label mask and display it above the time-frequency image.

    lbl = read(ads);
    im = zeros([imSize 3]);
    im(:,:,1) = lbl{1};
    hold on
    imagesc(im,AlphaData=0.5*lbl{1})
    hold off

    Figure contains an axes object. The axes object contains 2 objects of type image.

    Input Arguments

    collapse all

    Labeled signal set, specified as a labeledSignalSet object.

    Example: labeledSignalSet({randn(100,1) randn(10,1)},signalLabelDefinition("female")) specifies a two-member set of random signals containing the attribute "female".

    Label names, specified as a character vector, a string scalar, a cell array of character vectors, or a string array.

    Data Types: char | string

    Name-Value Arguments

    collapse all

    Specify optional pairs of arguments as Name1=Value1,...,NameN=ValueN, where Name is the argument name and Value is the corresponding value. Name-value arguments must appear after other arguments, but the order of the pairs does not matter.

    Example: [sds,ads] = createDatastores(lss,"Atom",TimeFrequencyMapFormat="image",TimeFrequencyLabelFormat="mask") creates datastores from the labeled signal set lss and time-frequency ROI label definition "Atom". The createDatastores function returns the time-frequency map image in sds and the ROI time-frequency label mask in ads.

    Format of time-frequency map, specified as one of these values:

    • "map"createDatastores stores the member signals as M-by-N matrices, where M is the number of frequency bins and N is the number of time windows. Each matrix represents the grayscale map of the spectrogram magnitude in dB.

    • "image"createDatastores stores the member signals as M-by-N-by-3 arrays, where M is the number of frequency bins and N is the number of time windows. Each array represents an image of the spectrogram magnitude in dB. The third dimension of each array represents the color intensity in red, green, and blue.

    When you specify TimeFrequencyMapFormat, createDatastores returns sigData as a TransformedDatastore object with one of the format options. The function chooses M and N automatically unless you specify these dimensions in TimeFrequencyImageSize.

    To use this input argument, you must specify roiTimeFrequency label definitions in lblNames.

    Data Types: char | string

    Size of time-frequency image, specified as a two-element vector of positive integers.

    When you specify TimeFrequencyImageSize as a vector [M N], createDatastores sets TimeFrequencyMapFormat as "image" and stores the member signals as M-by-N-by-3 arrays, where M is the number of frequency bins and N is the number of time windows. Each array represents an image of the spectrogram magnitude in dB. The third dimension of each array represents the color intensity in red, green, and blue.

    To use this input argument, you must specify roiTimeFrequency label definitions in lblNames.

    Data Types: double | single

    Format of time-frequency label, specified as one of these values:

    • "mask"createDatastores stores the labels of the member signals as M-by-N matrices, where M is the number of frequency bins and N is the number of time windows. Each value in each matrix represents the label value at the same indices as the corresponding signal time-frequency map.

    • "xywh"createDatastores stores the labels of the member signals as four-element vectors [x y w h] describing each instance of the label value, where:

      • x represents the starting column of the label matrix.

      • y represents the starting row of the label matrix

      • w indicates how many columns the label spans across.

      • h indicates how many rows the label spans across.

    • "xyMinMax"createDatastores stores the labels of the member signals as four-element vectors [xMin xMax yMin yMax] describing each instance of the label value, where:

      • xMin represents the minimum x value in the x-axis units of the time-frequency map.

      • xMax represents the maximum x value in the x-axis units of the time-frequency map.

      • yMin represents the minimum y value in the y-axis units of the time-frequency map.

      • yMax represents the maximum y value in the y-axis units of the time-frequency map.

    When you specify TimeFrequencyMapFormat, the function returns lblData as an arrayDatastore object with one of the format options.

    To use this input argument, you must specify roiTimeFrequency label definitions in lblNames.

    Data Types: char | string

    Mask priority of time-frequency map, specified as true, false, "ascending", "descending", a vector of strings, or a cell array of character vectors. TimeFrequencyMaskPriority specifies the hierarchy of overlapping labels.

    Specify a value for TimeFrequencyMaskPriority depending on the label data type of the labeled signal set specified in lss.

    • If lss.LabelDataType is "logical", specify TimeFrequencyMaskPriority as one of these values:

      • true — The function assigns priority to labels with value of "true" over labels with value "false".

      • false — The function assigns priority to labels with value of "false" over labels with value "true".

    • If lss.LabelDataType is "numeric", specify TimeFrequencyMaskPriority as one of these values:

      • "ascending" — The function assigns priority to labels with lower numeric values over labels with higher numeric values.

      • "descending" — The function assigns priority to labels with higher numeric values over labels with lower numeric values.

    • If lss.LabelDataType is "categorical", specify TimeFrequencyMaskPriority as a vector of strings or cell array of character vectors that includes the entire set of categorical values for the label definition. This vector or array specifies the order of priority, with the first category having highest priority.

    • If lss.LabelDataType is "string", specify TimeFrequencyMaskPriority as one of these values:

      • "ascending" — The function assigns priority to labels with lower alphabetical ordering over labels with higher alphabetical ordering.

      • "descending" — The function assigns priority to labels with higher alphabetical ordering over labels with lower alphabetical ordering.

    To use this input argument, you must:

    Data Types: char | string | logical

    Option to include partial bins in the time-frequency map, specified as 1 (true) or 0 (false). When you specify TimeFrequencyIncludePartialBins, createDatastores determines if the pixels in the time-frequency map must include an entire time and frequency bin.

    To use this input argument, you must specify roiTimeFrequency label definitions in lblNames.

    Data Types: double | single | logical

    Output Arguments

    collapse all

    Signal data, returned as a signalDatastore (Signal Processing Toolbox) object, an audioDatastore (Audio Toolbox) object, or a TransformedDatastore object.

    Label data, returned as an arrayDatastore object.

    Version History

    Introduced in R2021a

    expand all